
Extended Data Figure 1. pPVTD2R neuron activity during fear conditioning and retrieval.
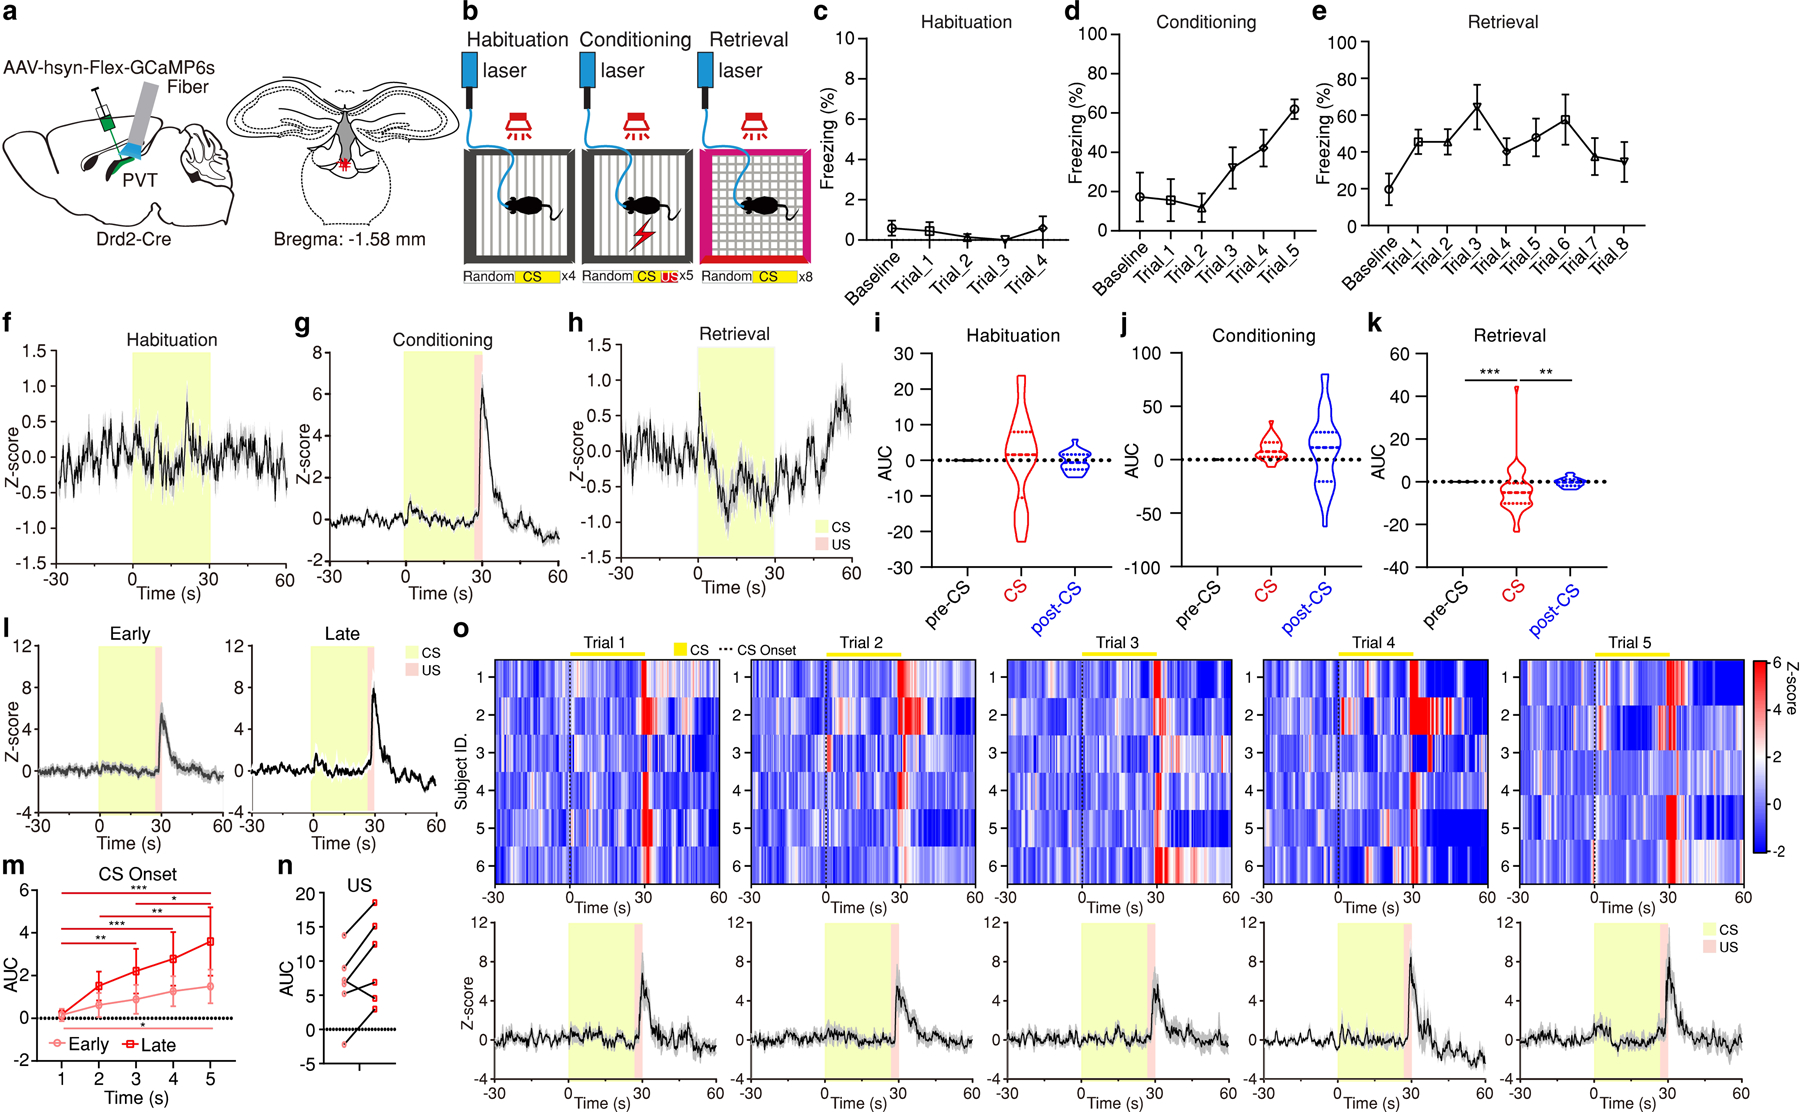
a, Representative image of GCaMP6s expression in pPVTD2R neurons and optical fiber placements (n = 6 mice). b, Experimental paradigm. c-e, Freezing behavior during the habituation (c), conditioning (d) and retrieval (e) sessions. f-h, Average calcium responses during the habituation (f), conditioning (g) and retrieval (h) sessions. i-k, Quantification of calcium signal during habituation (i), conditioning (j) and retrieval (k) sessions. AUC, One-way ANOVA followed by two-stage linear step-up procedure of Benjamini, Krieger and Yekutieli. Habituation: n = 20 Trials; F(2, 57) = 0.1. Conditioning: n = 30 Trials; F(2, 87) = 2.17. Retrieval: n = 48 Trials; F(2, 141) = 7.7; group comparisons, pre-CS vs CS ***P = 0.0006, CS vs post-CS **P = 0.0012. l, Average calcium responses during early (Trials 1–3; left) and late (Trials 4–5; right) conditioning trials. m, Quantification of calcium signal during the first 5 s following the onset of CS during conditioning sessions. AUC, Two-way ANOVA followed by two-stage linear step-up procedure of Benjamini, Krieger and Yekutieli, n = 12 Trials; F(4, 112) = 1.49. Group comparisons: Early, 1 s vs 4 s P = 0.054, 1 s vs 5 s *P = 0.021; Late, 1 s vs 3 s **P = 0.0043, 1 s vs 4 s ***P = 0.0003, 1 s vs 5 s ***P < 0.001, 2 s vs 5 s **P = 0.0035, 3 s vs 5 s *P = 0.049. n, Calcium signal during US presentation in the late trials is higher than the early trials (n = 6 mice; two-tailed paired Student’s t-test, P = 0.054). o, Top: Heatmaps showing calcium responses of Conditioning Trials 1–5 from individual subjects, respectively. Bottom: Average calcium responses of the top panels. All data in figure shown as mean ± s.e.m.