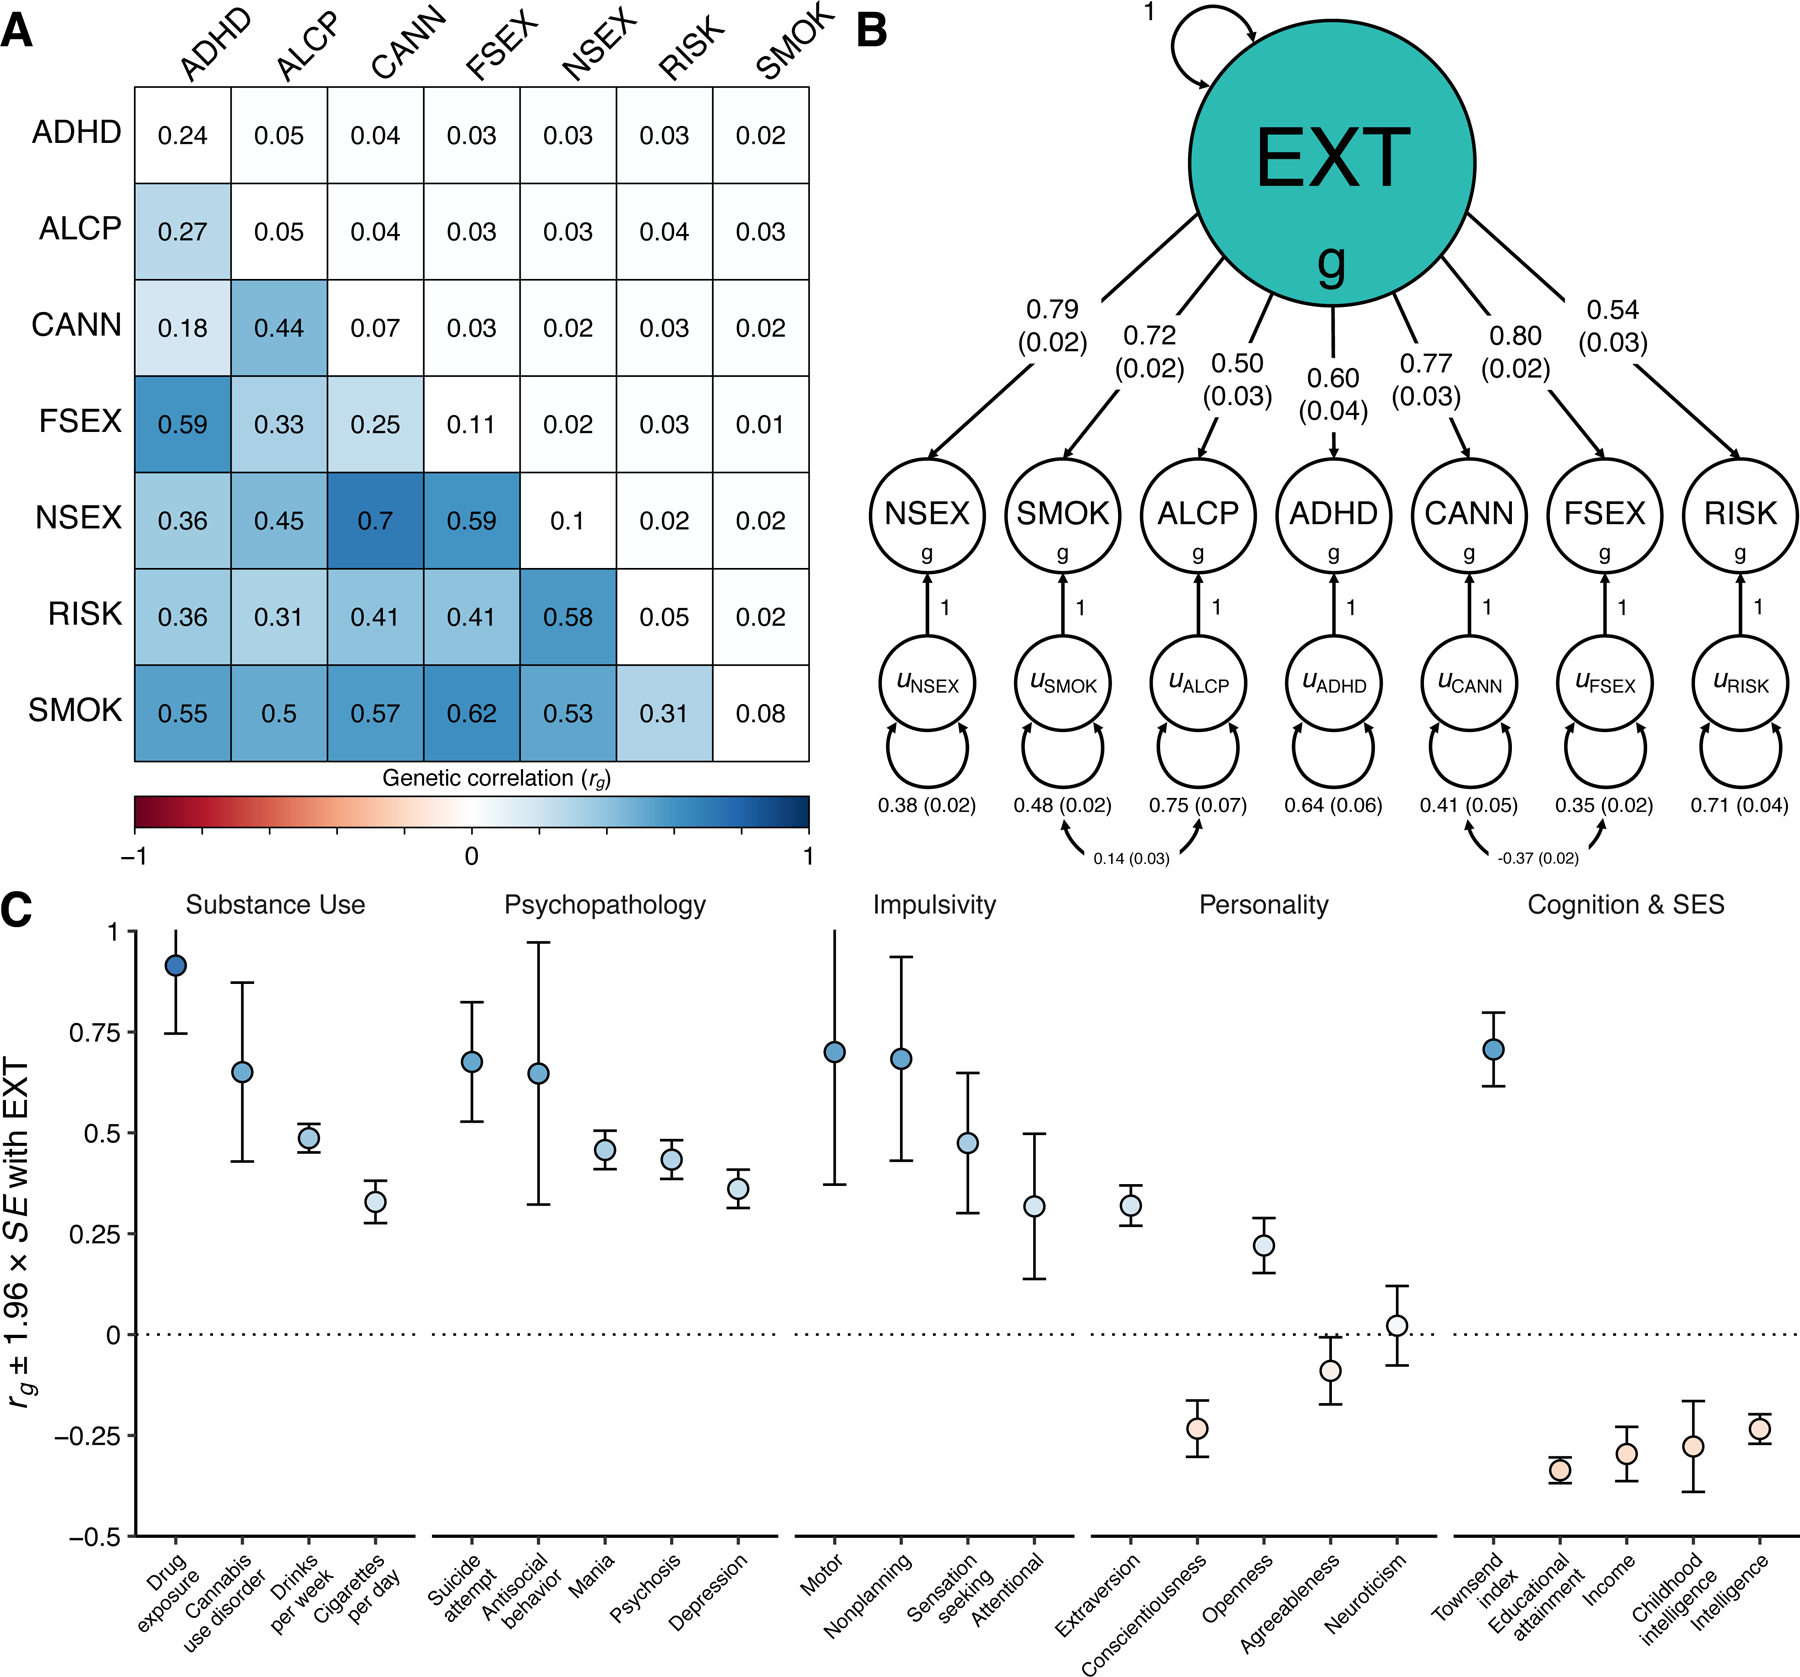
Figure 1 |. Genetic correlations and structural equation modeling with Genomic SEM.

(A) The lower and upper triangles display pair-wise LD Score genetic correlations (rg) and their standard errors, respectively, among the final seven discovery phenotypes (Table 1), and the diagonal displays observed-scale SNP heritabilities (h2) (see Table 1 for standard errors). (B) Path diagram of the final revised common factor model estimated with Genomic SEM. The factor loadings were standardized, and standard errors are presented in parentheses. (C) Genetic correlations (rg) between the genetic externalizing factor (EXT, N = 1,492,085) and a subset of phenotypes selected to establish convergent and discriminant validity (Supplementary Table 8 reports all 91 estimated genetic correlations together with the exact number of independent samples used to derive each estimate), where blue and red bars represent positive and negative genetic correlations, respectively, using the same color scale as in panel A. Error bars represent 95% confidence intervals centered on the rg estimate, computed as 1.96 times the standard error. ADHD is attention deficit hyperactivity disorder (N = 53,293), ALCP is problematic alcohol use (N = 164,864), CANN is lifetime cannabis use (N = 186,875), EXT is externalizing, FSEX is reverse-coded age at first sex (N = 357,187), NSEX is number of sexual partners (N = 336,121), RISK is general risk tolerance (N = 426,379), and SMOK is lifetime smoking initiation (N = 1,251,809).
