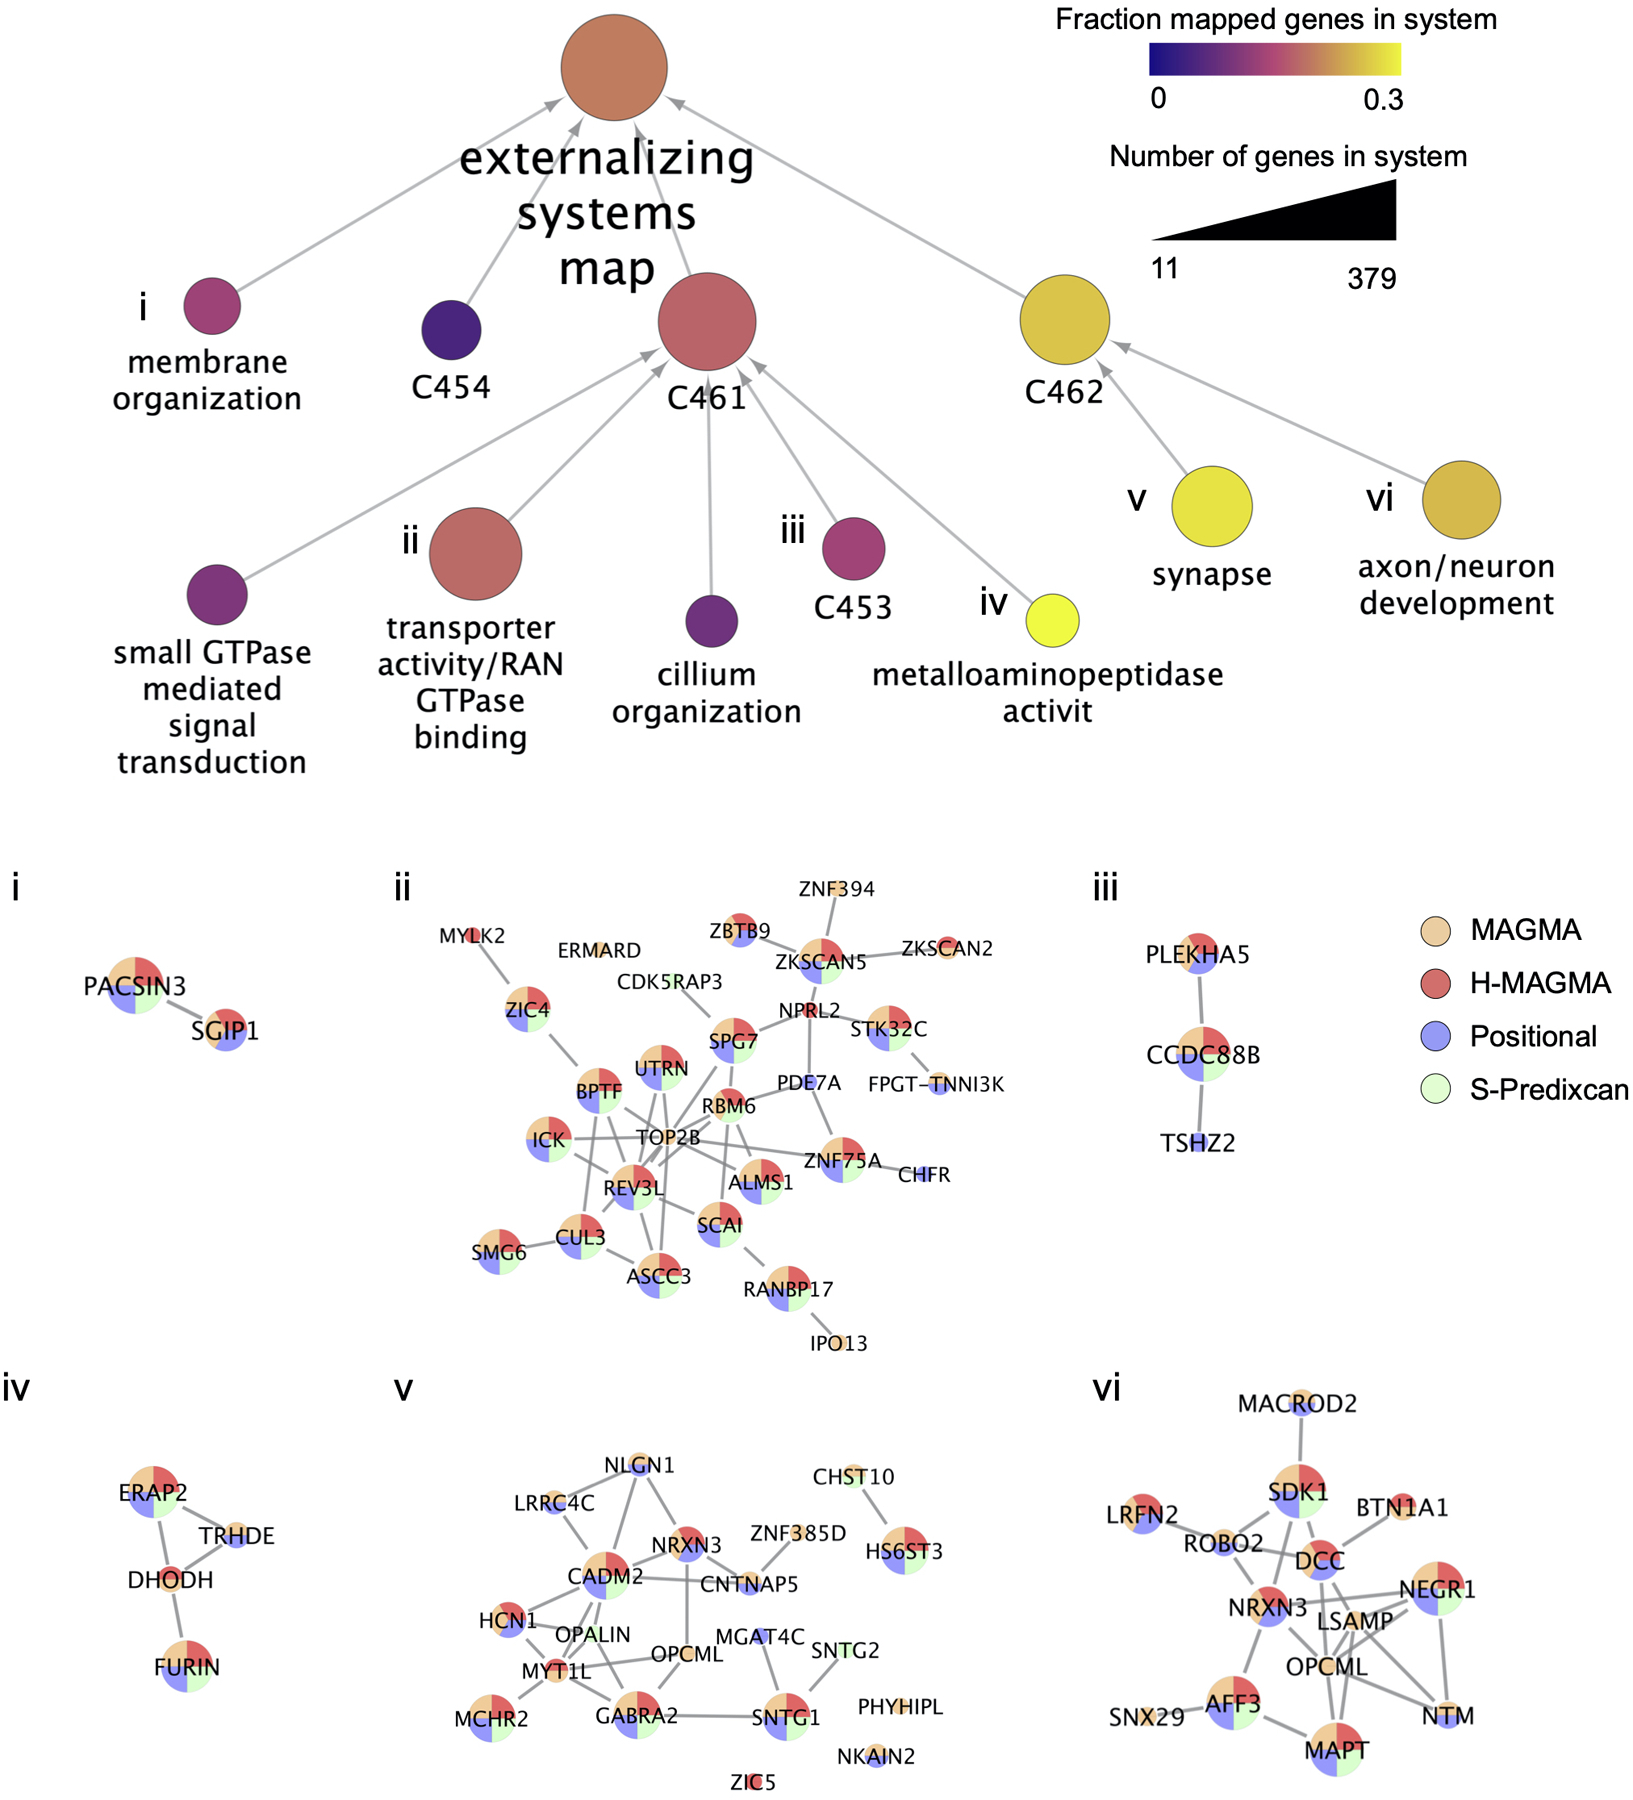
Extended Data Fig. 8. Externalizing systems map estimated with the Order Statistics Local Optimization Method (OSLOM) algorithm.

Representation of the externalizing network neighborhood estimated with PCNet as modular gene systems. In the top panel, circles represent distinct systems, with size indicating the number of genes belonging to each system (min 11 for “cilium organization”, and max 379 for the “externalizing systems map”). System color indicates the fraction of genes in each system that have been mapped to the externalizing phenotype by at least one of the four gene mapping methods (positional, MAGMA, H-MAGMA, and S-PrediXcan). Systems have been annotated with significantly enriched gene ontology terms. Systems without significant enrichment of biological pathways are labeled with a unique system ID (C454, C461, C453, C462), and may represent novel pathways. (i-vi) Visualization of genes within selected systems that have been mapped to the externalizing phenotype by one or more gene mapping methods, and their molecular interactions. In the bottom panel, the gene size is mapped to the number of methods in which the gene was found associated with externalizing (with the largest genes indicating the gene was identified by all 4 methods), and gene color(s) indicates which method(s) have mapped the gene.
