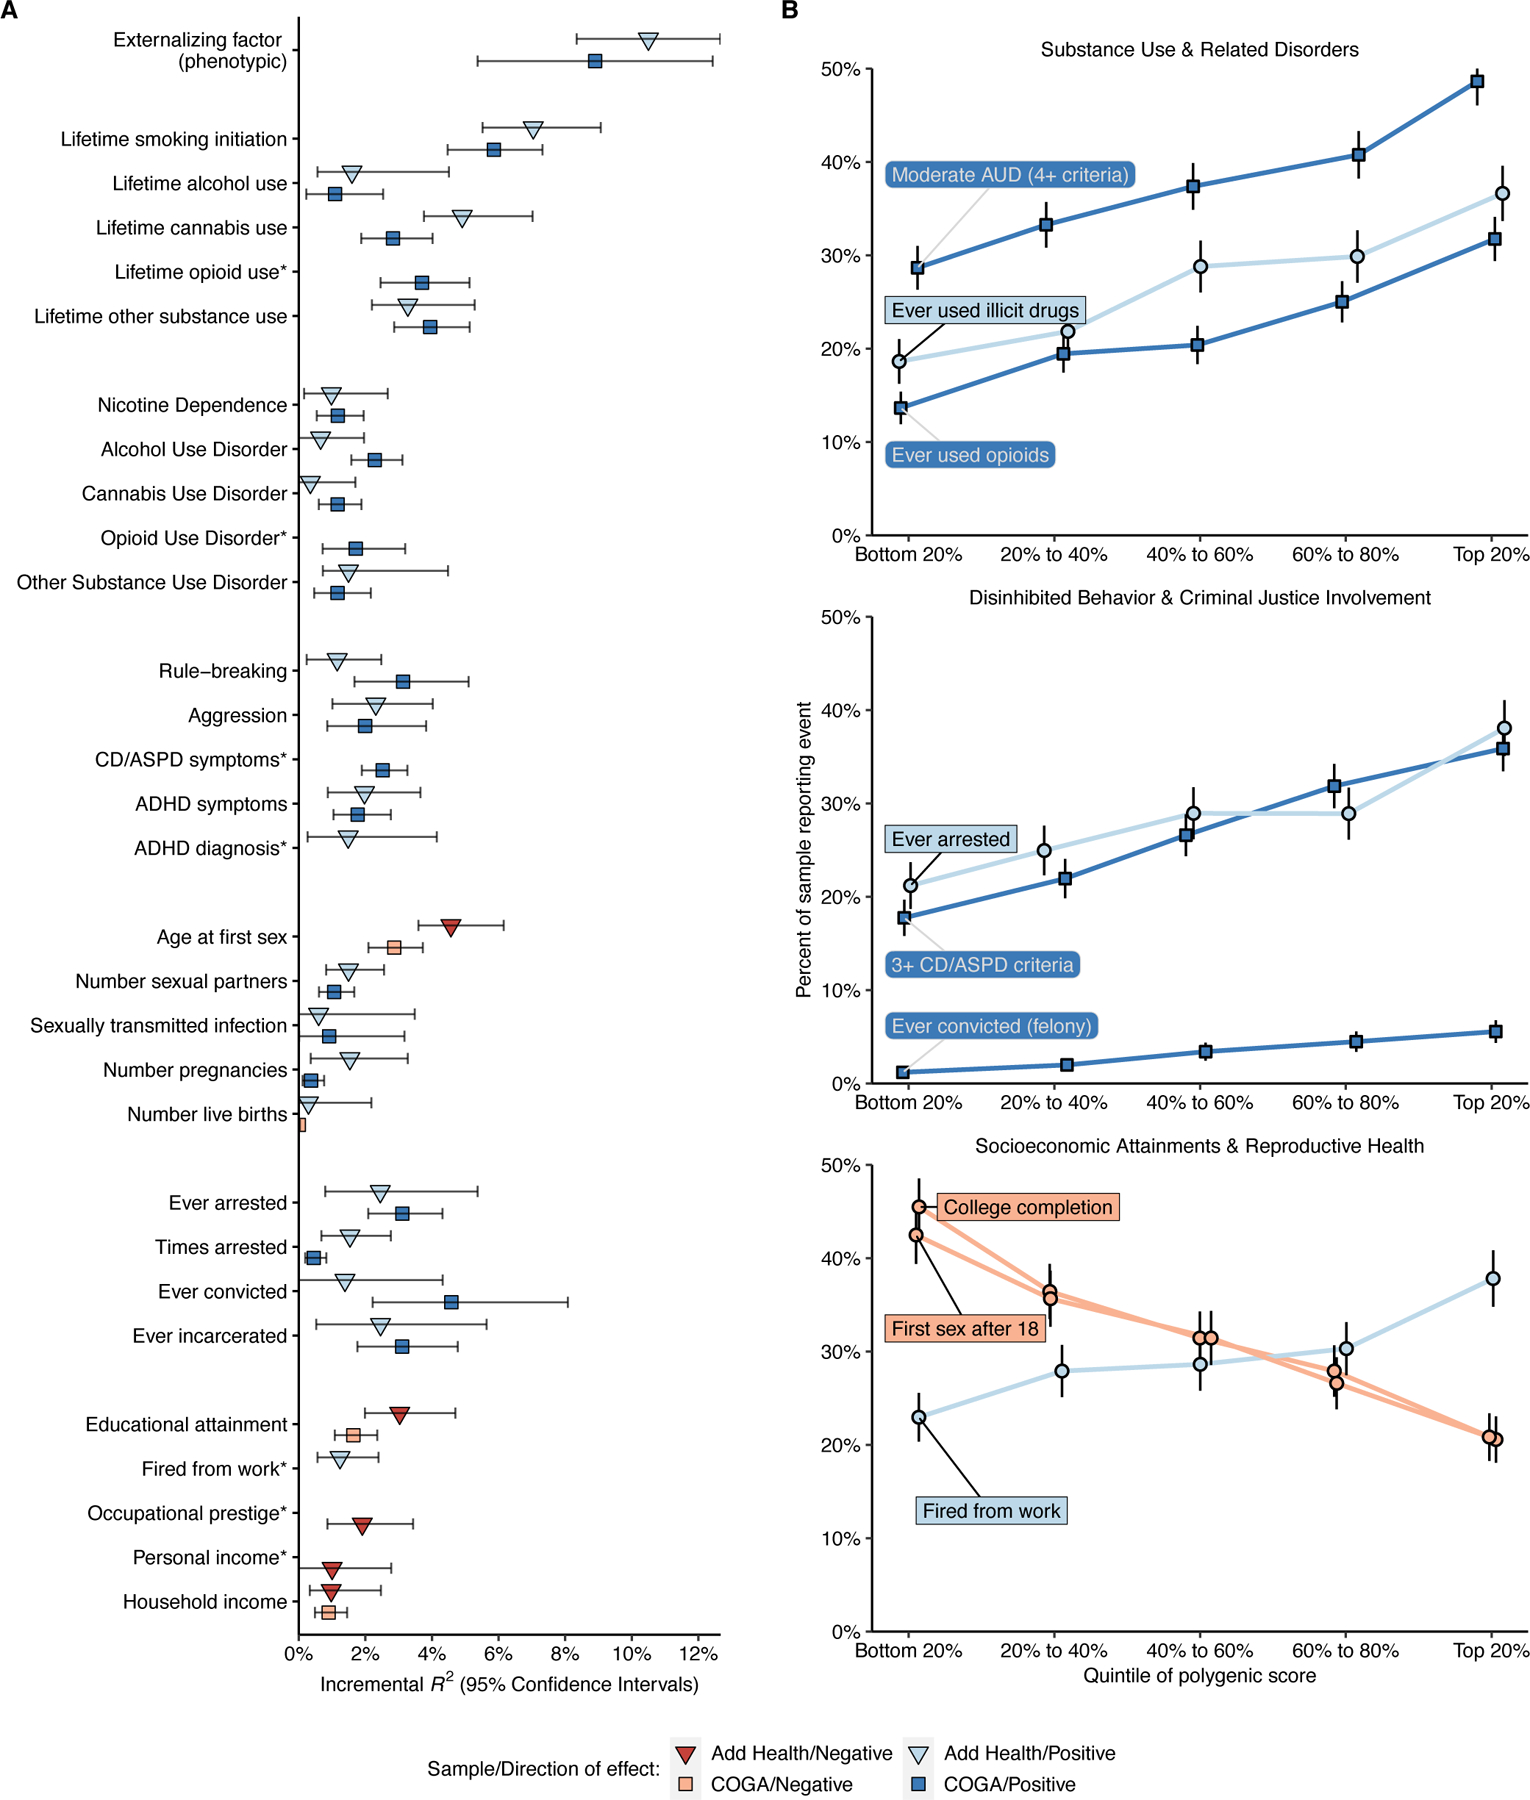
Figure 3 |. Genome-wide EXT polygenic score associations with behavioral, psychiatric, and social outcomes in the independent Add Health (N = 5,107) and COGA (N = 7,594) datasets.

(A) Scatter plots illustrating the incremental proportion of variance (incremental R2, or ΔR2) explained by the genome-wide PRS-CS polygenic score. Light and dark hue indicates the Add Health and COGA cohort, respectively. Blue and red bars indicate positive and negative associations, respectively. The error bars represent 95% confidence intervals centered on ΔR2, computed as 1.96 times the standard error (estimated using percentile method bootstrapping over 1000 bootstrap samples). (B) Line charts illustrating the relative risks across quintiles of the polygenic score for eight (binary or dichotomized) illustrative outcomes: (1) meeting 4 or more criteria for alcohol use disorder (AUD), (2) lifetime use of an illicit substance other than cannabis, (3) lifetime opioid use, (4) ever being arrested, (5) meeting 3 or more criteria for conduct disorder (CD) or antisocial personality disorder (ASPD), (6) ever being convicted of a felony, (7) completing college, and (8) first sexual intercourse at the age of 18 or older. The error bars represent 95% confidence intervals centered on the per-quintile prevalence, computed as 1.96 times the analytical standard error.
