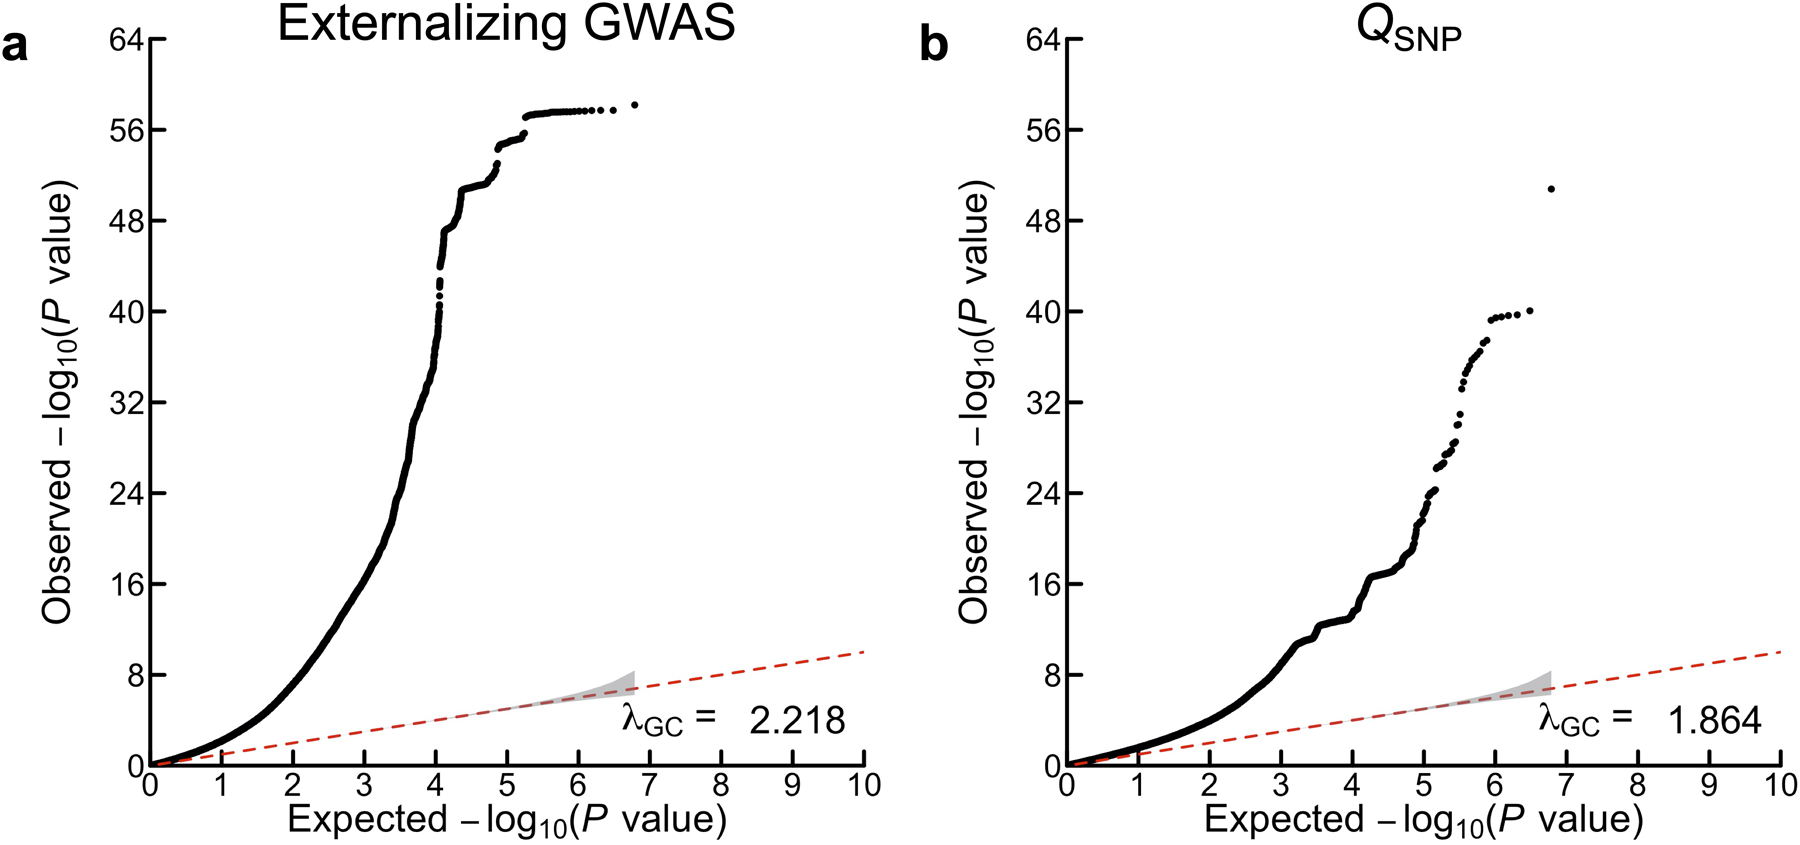
Extended Data Fig. 2. Quantile-quantile (Q-Q) plots of the externalizing GWAS and QSNP results.

The panels display Q-Q plots for (a) the externalizing GWAS (Neff = 1,492,085), and (b) SNP-level tests of heterogeneity (QSNP) with respect to the SNP-effects estimated in the externalizing GWAS (for more details see Supplementary Information section 3). The y-axis is the observed association P value on the −log10 scale (based on a two-sided Z-test in panel a, and based on a one-sided χ2 test scaled to 1 degree of freedom in panel b). The gray shaded areas represent 95% confidence intervals centered on the expected −log10(P) of the null distribution. The genomic inflation factors displayed here, λGC, is defined as the median χ2 association test statistic divided by the expected median of the χ2 distribution with 1 degree of freedom, and were calculated with 6,132,068 and 6,107,583 SNPs for (a) and (b), respectively. Although there is a noticeable early “lift-off”, the estimated LD Score regression intercepts of (a) 1.115 (SE = 0.019) and (b) 0.9556 (SE = 0.013) suggest that most of the inflation of the test statistics is attributable to polygenicity rather than bias from population stratification
