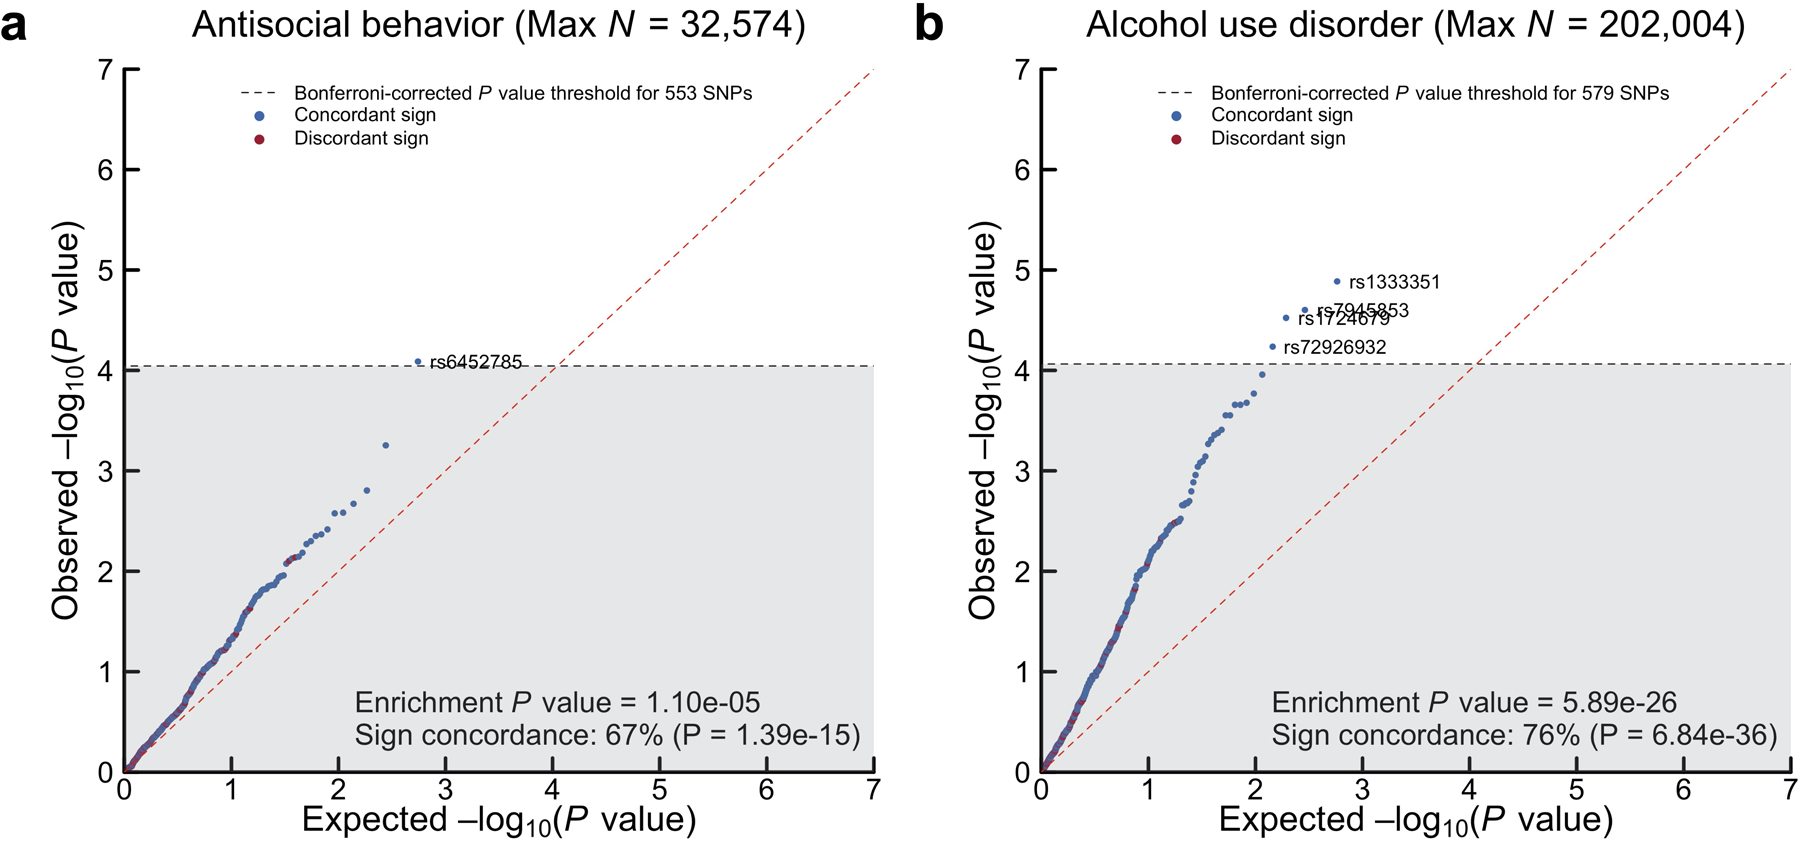
Extended Data Fig. 3. Quantile-quantile (Q-Q) plots of the proxy-phenotypes analyses.

Panels (a–b) show −log10(P values from a two-sided Z-test) for linear regression of the 553 and 579 EXT SNPs (or such SNPs that could be proxied in case of missingness, r2 > 0.8) that were looked up in independent, second-stage GWAS samples on (1) antisocial behavior (N = 32,574) and (2) alcohol use disorder (N = 202,400), respectively (Supplementary Information section 4). Dashed line denotes experiment-wide significance at P < 0.05/553 and 0.05/579 for (1) and (2), respectively. Enrichment P value is the result of a one-sided test of joint enrichment with the non-parametric Mann-Whitney test against an empirical null distribution of 138,250 and 144,750 near-independent (r2 < 0.1) SNPs, matched on MAF, that were randomly selected from the GWAS on (1) and (2), respectively. Sign concordance is the proportion of looked-up SNPs with concordant direction of effect sizes across the externalizing GWAS and the second-stage GWAS, and the sign concordance P value is from a one-sided binomial tests of the sign concordance for the 579 SNPs (against the null hypothesis of 50% concordance that is expected by chance).
