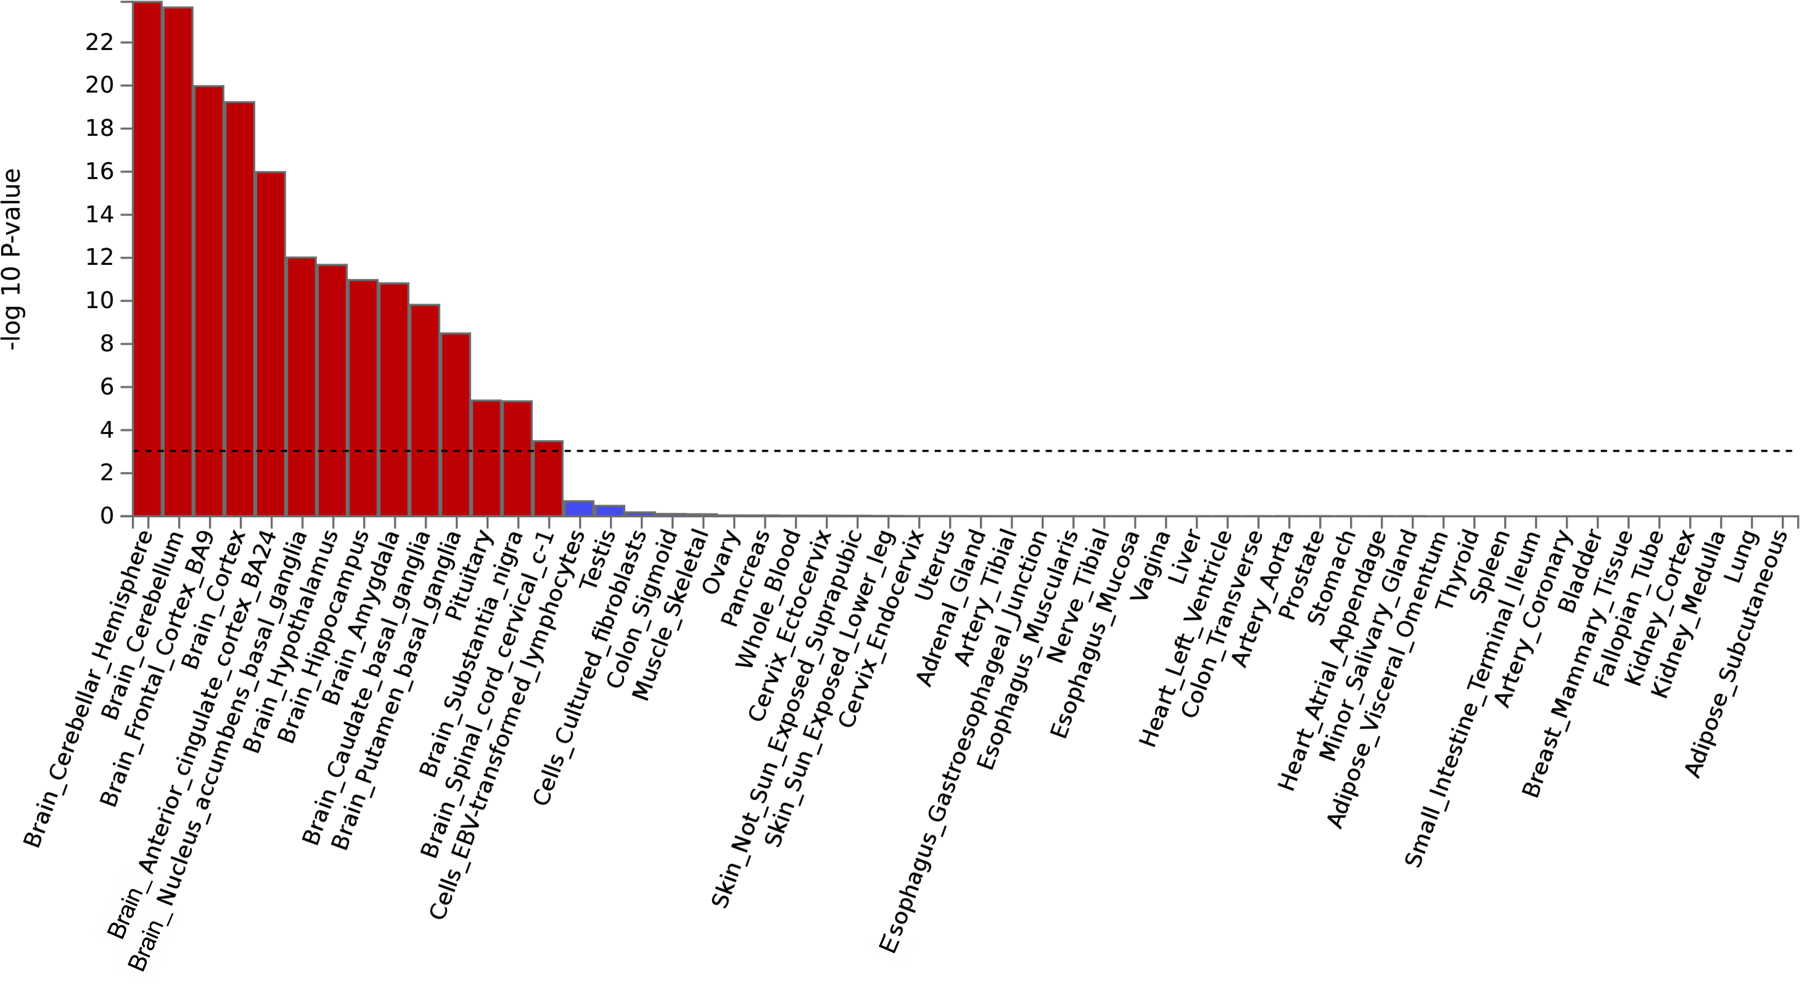
Extended Data Fig. 5. MAGMA gene-property analysis.

Bar plot of the −log10(P from one-sided Z-tests) of the point estimate from a generalized least squares regression. The analysis identified that the externalizing GWAS is significantly enriched in brain and pituitary gland tissues (Supplementary Information section 6). Dashed line denotes Bonferroni-corrected significance, adjusted for testing 54 tissues (one-sided P < 9.26×10⁻⁴). 14 tissues were significantly associated with the externalizing GWAS, including 13 brain related tissues and the pituitary tissue. The results are also report in Supplementary Table 15.
