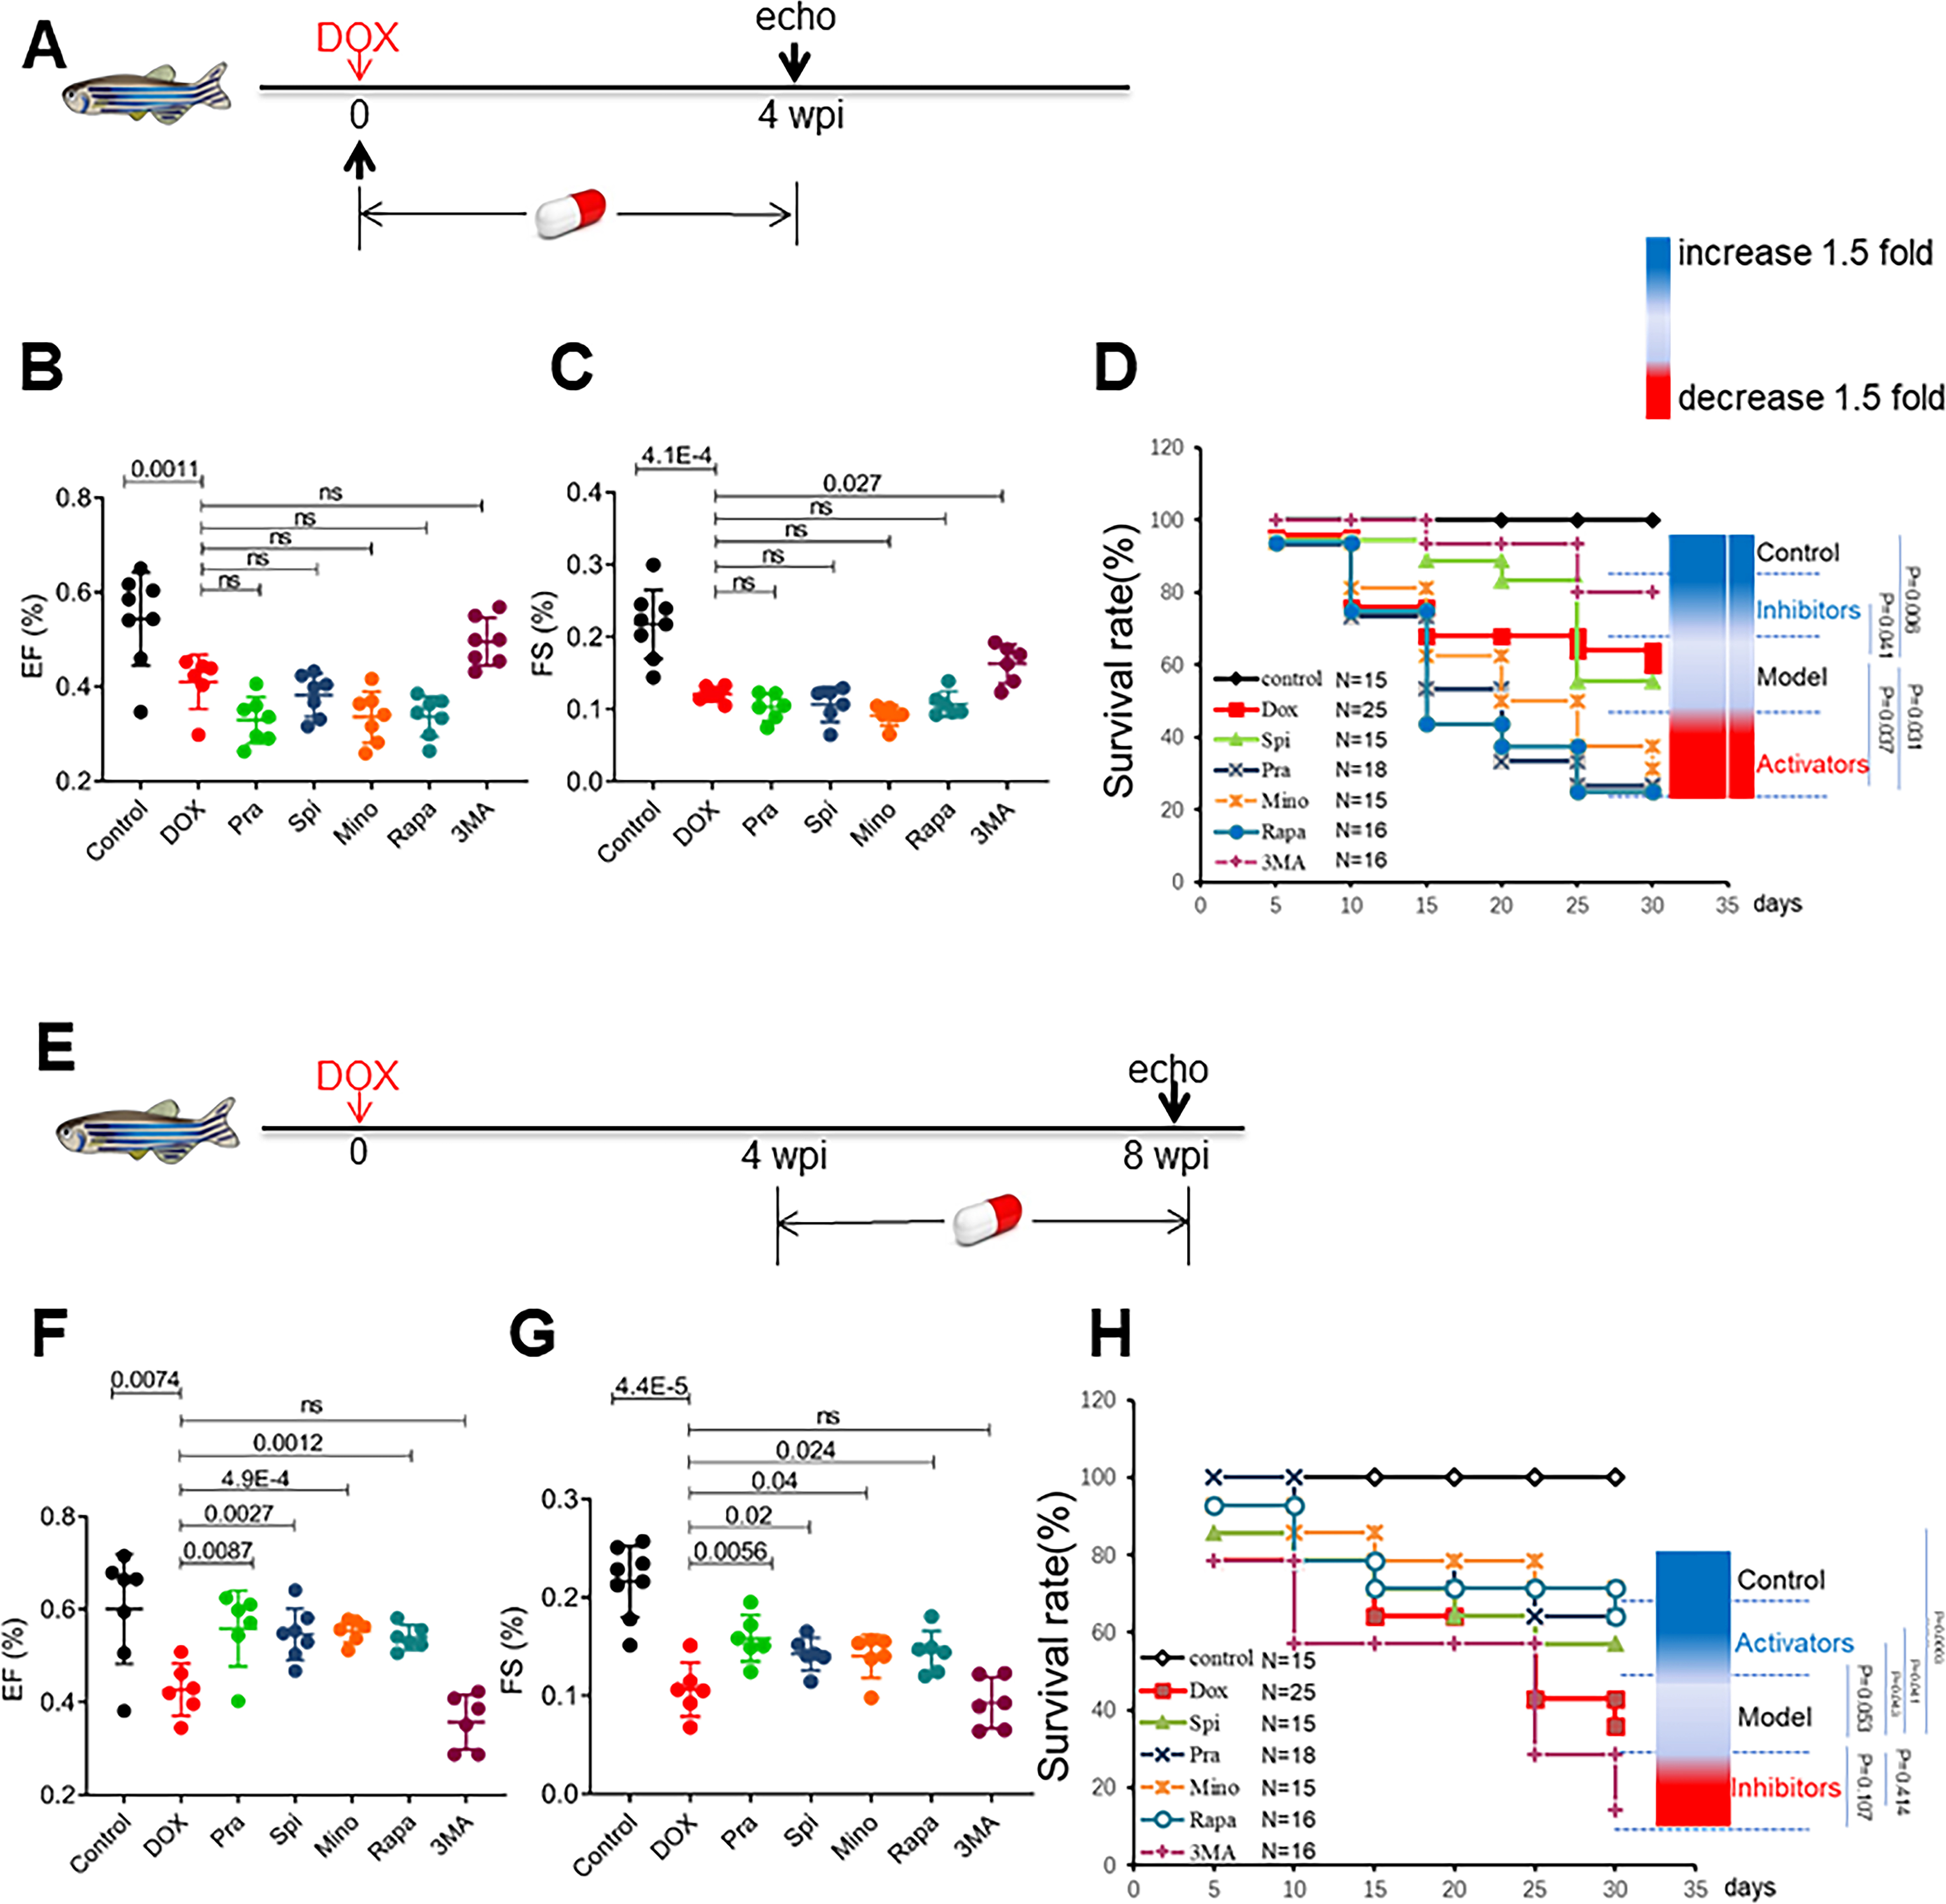
Fig 5. Top-ranking FAAs used with the eAIC model exerted therapeutic effects in the zebrafish aAIC model in a time-dependent fashion.

(A) Schematics of the experimental procedure for drug administration in the early phase of aAIC. (B and C) High-frequency echocardiography was performed to evaluate cardiac function. (D) Kaplan–Meier survival curves showing the survival of DOX-stressed adult fish after drug administration in the early phase. n=15~25. (E) Schematics of the experimental procedure for drug administration in the late phase of aAIC. (F and G) High-frequency echocardiography was performed 8 wpi to evaluate cardiac functions. (H) Kaplan–Meier survival curves showing the survival of DOX-stressed adult zebrafish after drug administration in the late phase. n=15~25. Log-rank test was used in (D) and (H) for comparisons; one-way ANOVA followed by post hoc Tukey’s test in (B), (C), (F) and (G). wpi, weeks after DOX injection. WT, wild type; DOX, doxorubicin.
