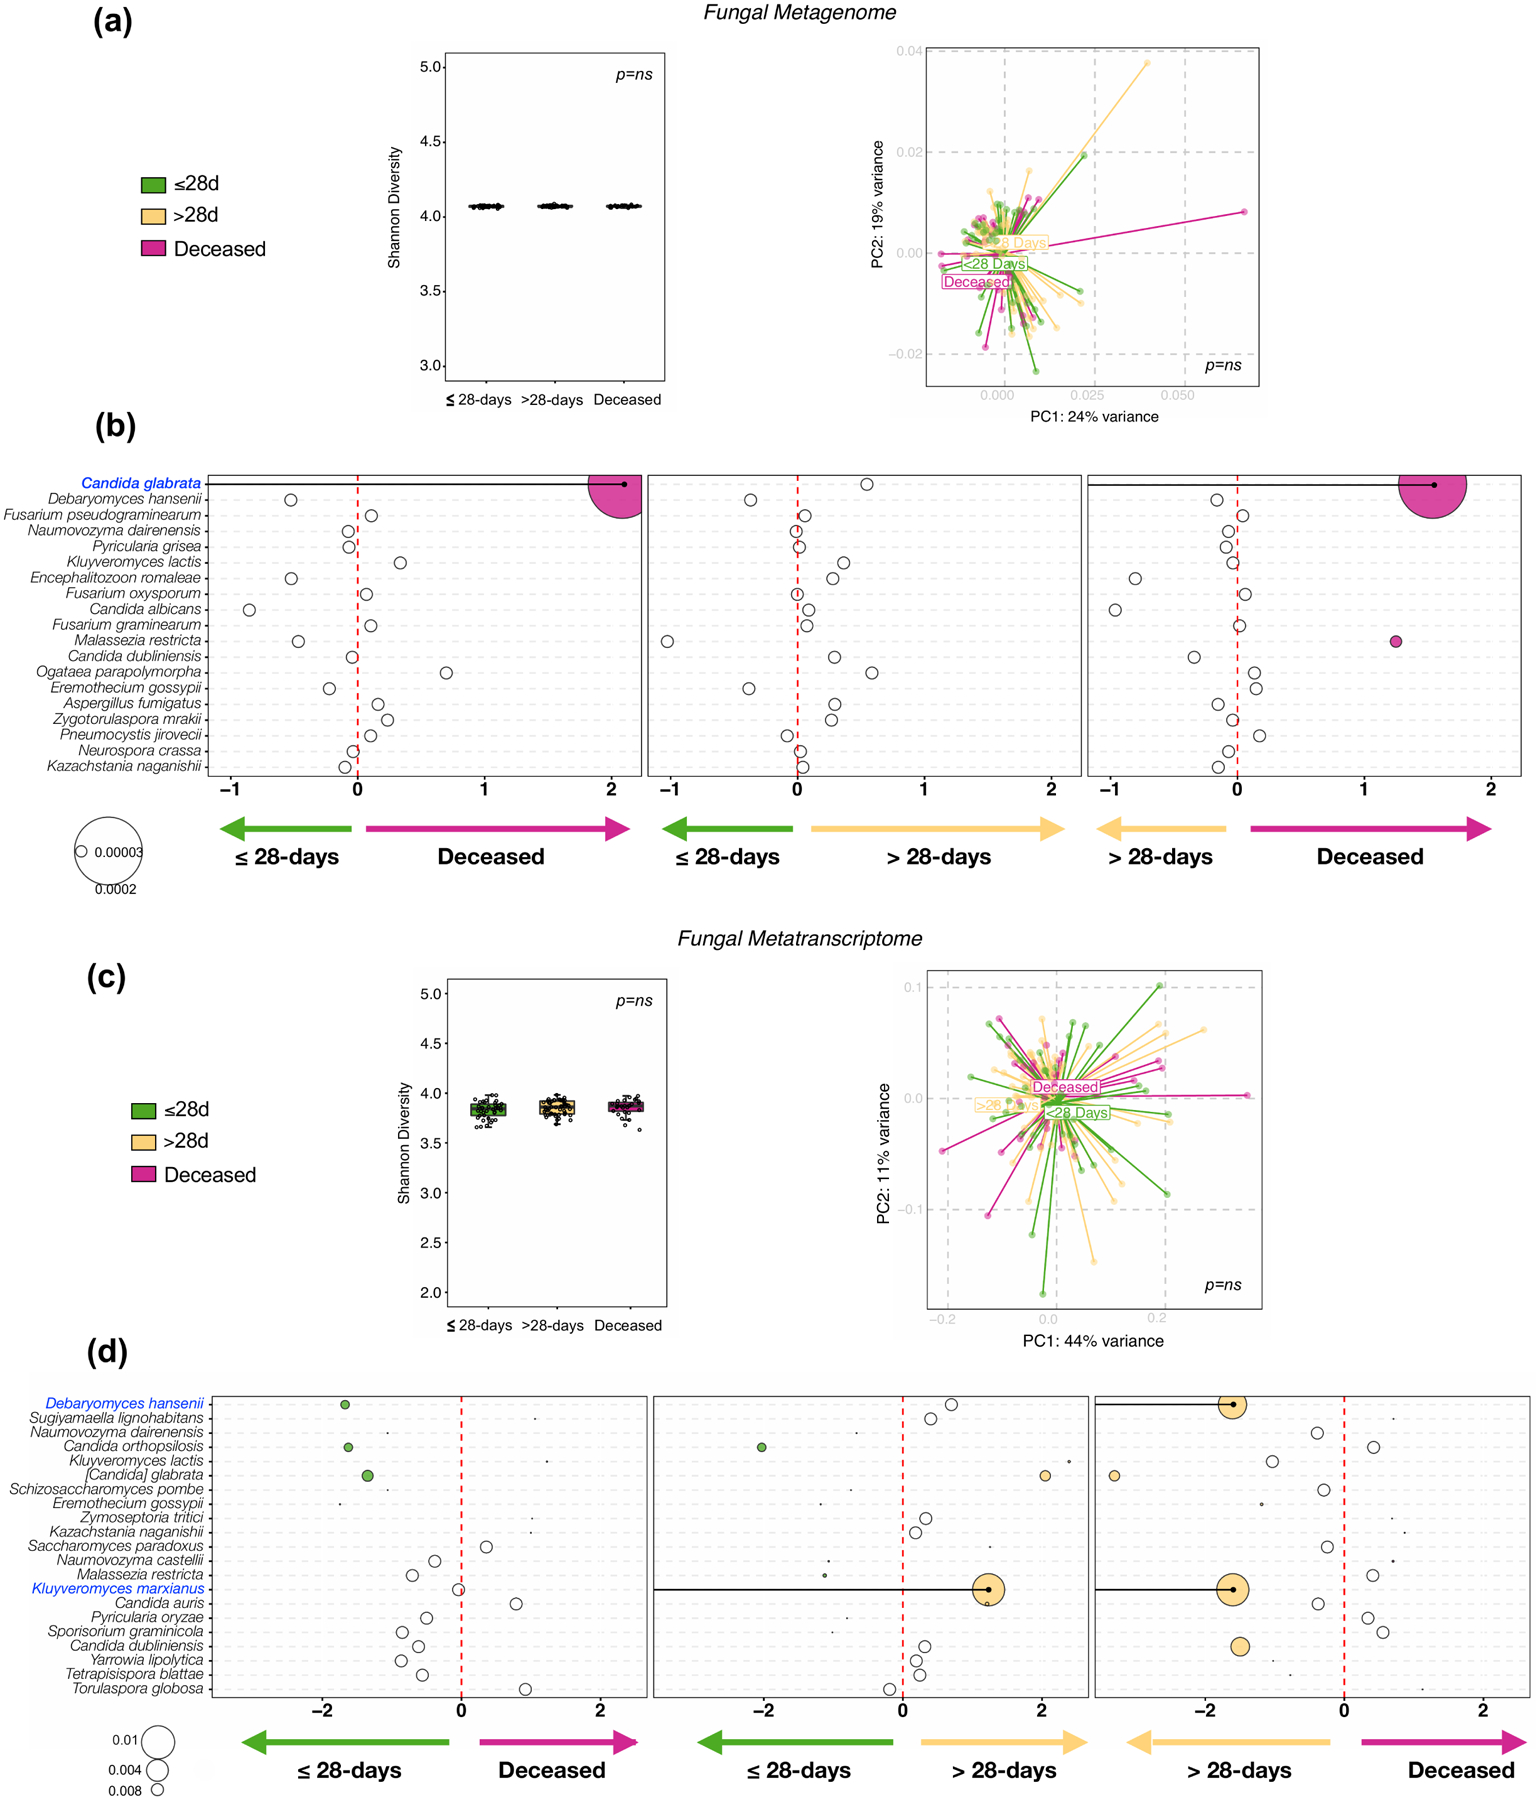
Extended Data Fig. 5. Evaluation of associations between the lower airway mycobiome and clinical outcome.

Fungal taxonomic data was subtracted from metagenome and metatranscriptome data from 5 background negative controls (bronchoscope), 118 bronchoalveolar lavage (BAL) and 64 upper airway (UA) samples.. (a) Comparisons between the three clinical outcome groups was performed for α diversity (Shannon Index, each dot denotes the Shannon diversity of a sample while the box center depicts median, box inter-quartile range with median at the center and whiskers represent maximum and minimum value, left panel), β diversity (based on Bray Curtis Dissimilarity Index, right panel); Kruskal-Wallis p-value and PERMANOVA p-value respectively; on metagenome data. (b) Bubble plot showing DESeq results of fungi enriched in each clinical outcome comparisons based on metagenome data (bubble size based on median relative abundance for those found to be statistically significant). (c) Comparisons between the three clinical outcome groups was performed for α diversity (Shannon Index, each dot denotes the Shannon diversity of a sample while the box center depicts median, box inter-quartile range with median at the center and whiskers represent maximum and minimum value, left panel), β diversity (based on Bray Curtis Dissimilarity Index, right panel); Kruskal-Wallis p-value and PERMANOVA p-value respectively; on metatranscriptome data. (d) Bubble plot showing DESeq results of fungi enriched in each clinical outcome comparisons based on metatranscriptome data (bubble size based on median relative abundance for those found to be statistically significant).
