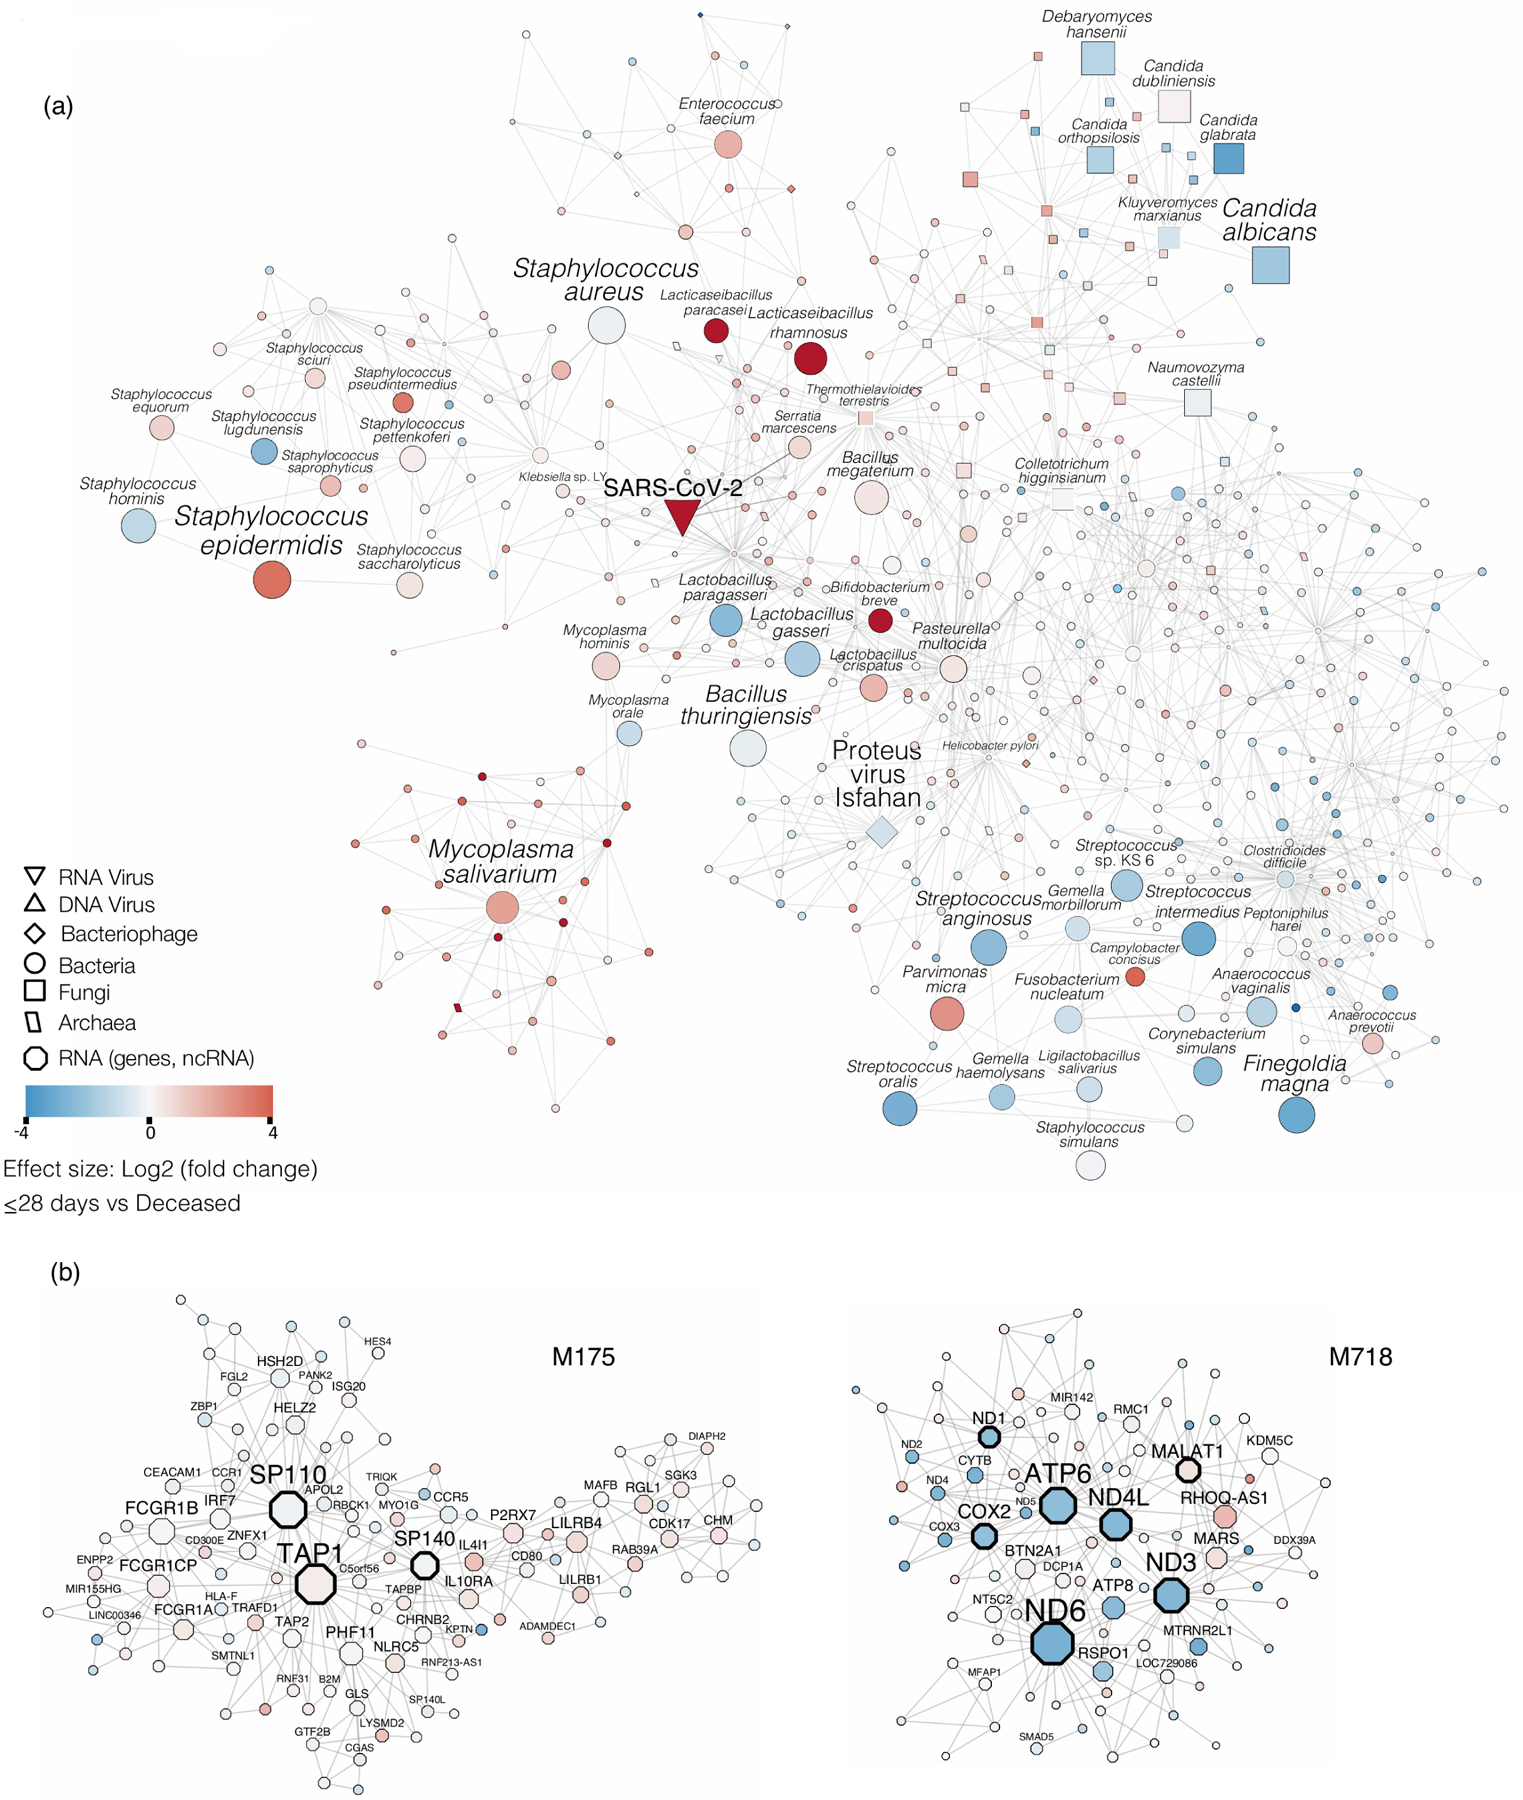
Extended Data Fig. 10. Multi-scale cross-kingdom and co-expression networks.

The neighborhood 5 cross-kingdom metatranscriptome network centered around SARS-CoV-2 is shown. Nodes refer to taxa, edges denote co-abundance after MEGENA. The size of the nodes indicates abundance. Taxa with large nodes are highly abundant. Node shapes are according to the legend and refer to different microbial kingdoms. The differential abundance of taxa in log2(fold change) between the deceased group and the ≤28-day MV groups is shown by node color - red nodes are taxa abundant in the deceased group compared to the ≤28-day MV group, blue colored nodes denote the opposite. (b) Modules M175 and M718 of the host transcriptome are shown. The node size refers to the absolute gene expression value. Nodes with wide node border refer to key regulators/hub genes (see Methods). The differential gene expression of taxa in log2(fold change) between the deceased group and the ≤28-day MV groups is shown by node color - red nodes are up-regulated in the deceased group compared to the ≤28-day MV group, blue colored nodes denote the opposite.
