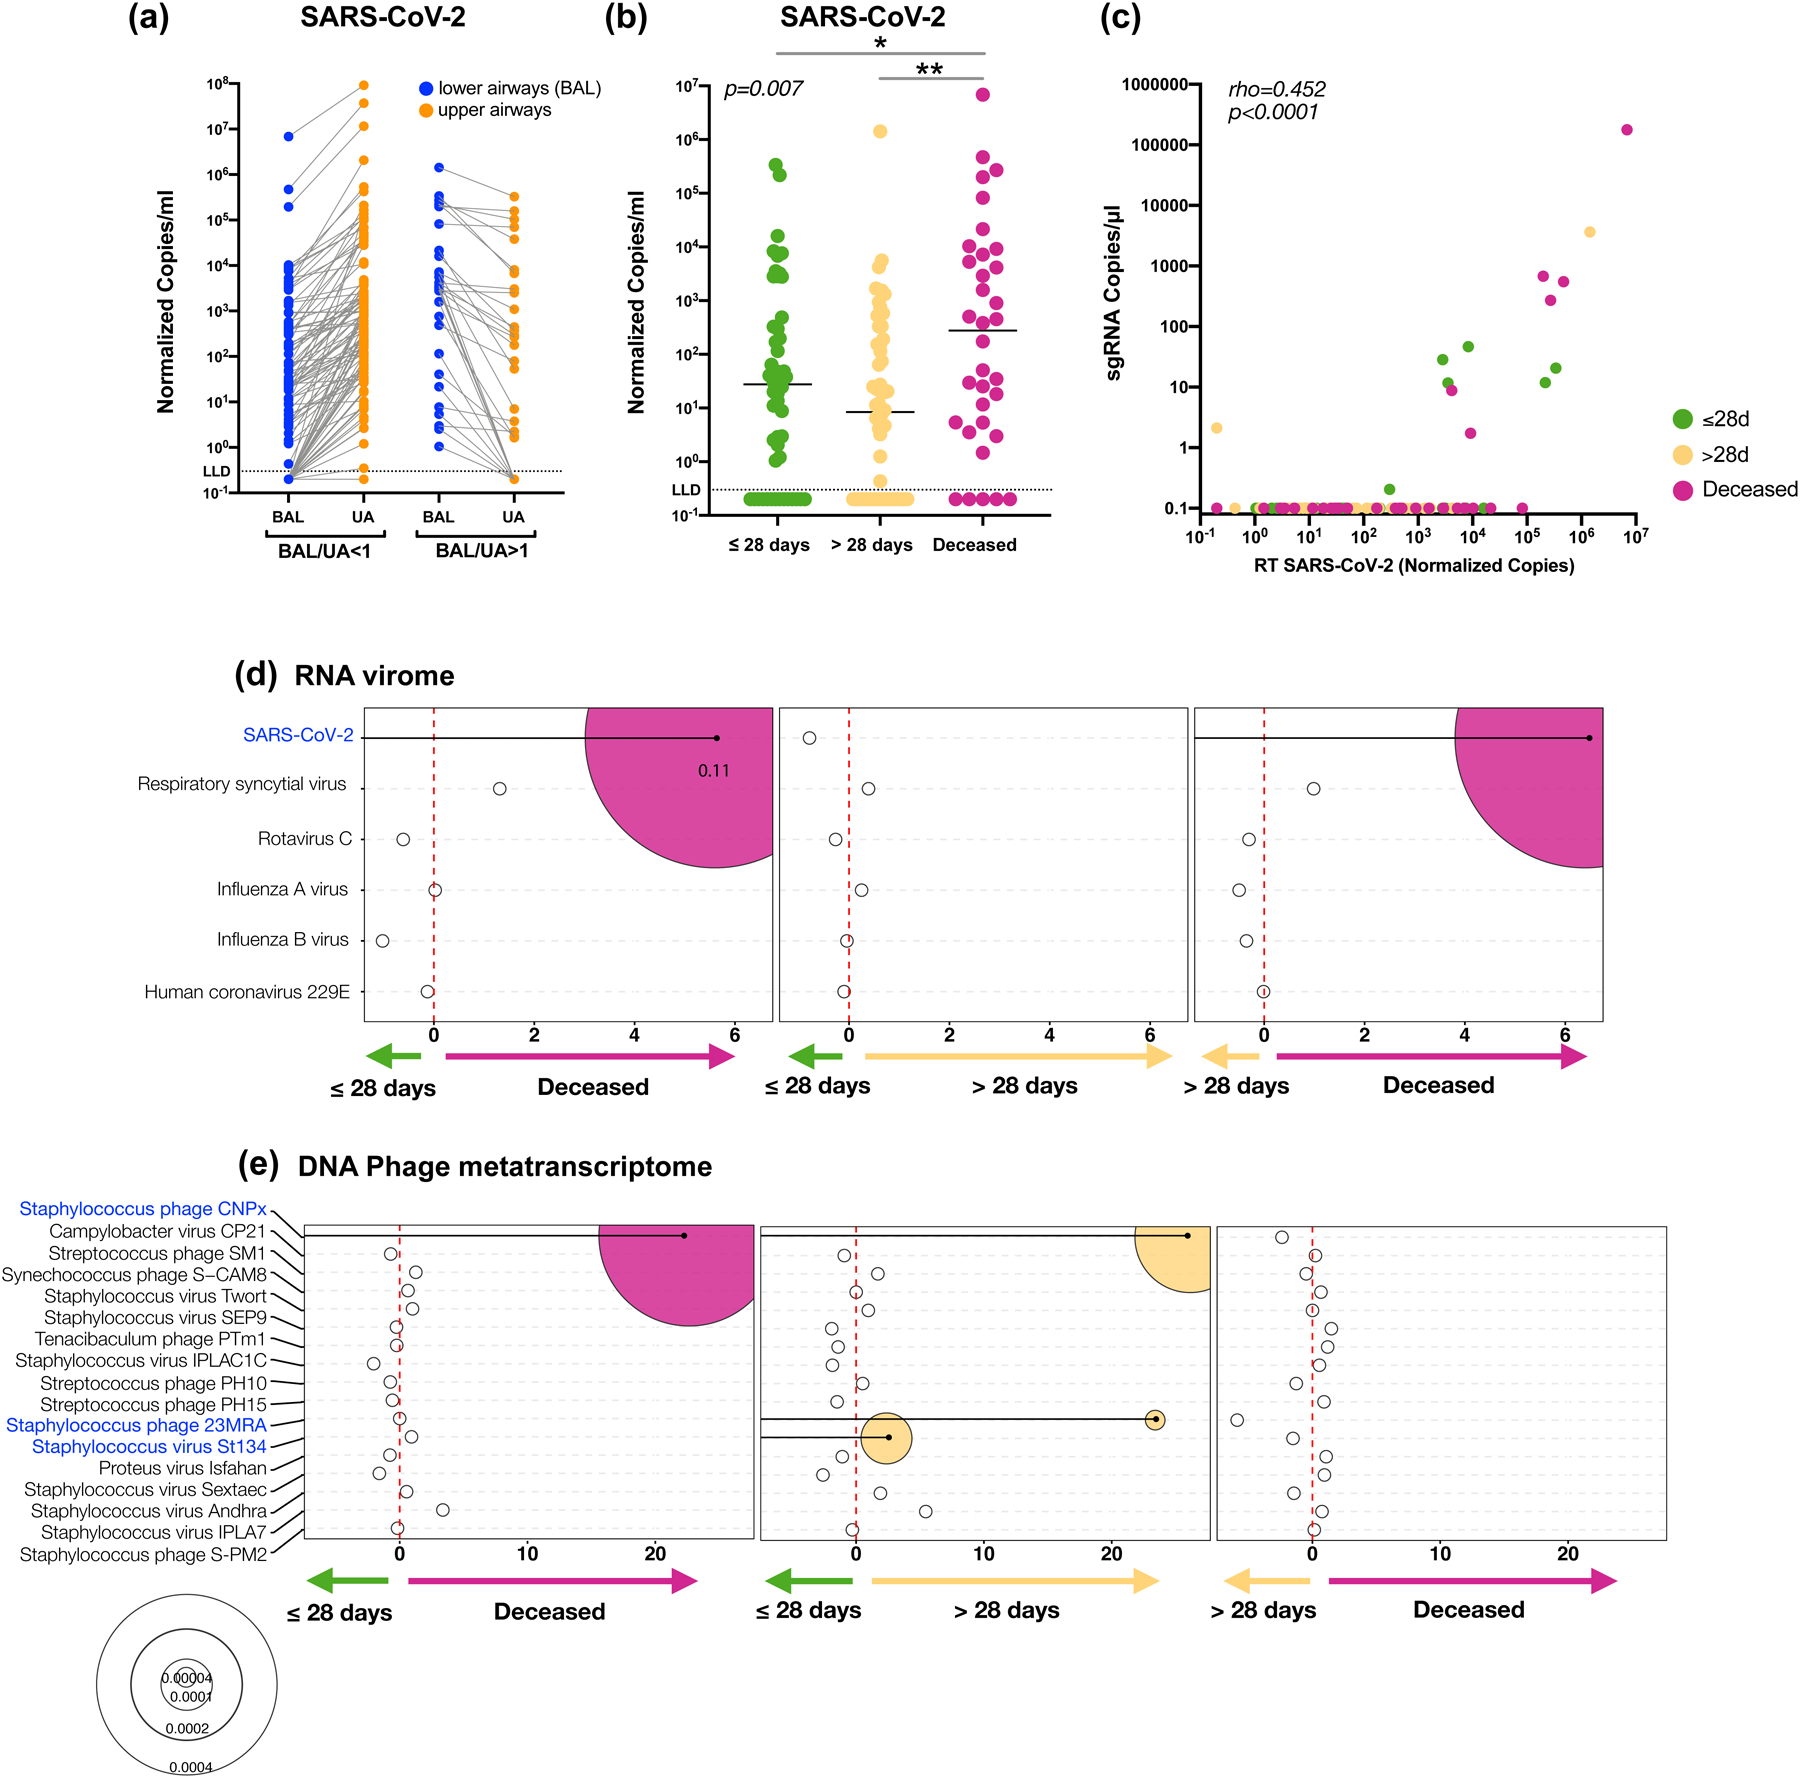
Figure 2. SARS-CoV-2 viral load and virus metatranscriptome analyses.

Copies of the SARS-CoV-2 N gene per ml, normalized by the Human RNase P gene, comparing paired upper and lower airway samples (a) and levels in BAL comparing clinical outcome groups in 142 subjects (b, *= Two-sided Mann–Whitney U p=0.038, **= Two-sided Mann–Whitney U p=0.001;). (c) PCoA analysis based on Bray Curtis Dissimilarity index of BAL Metatranscriptome data comparing clinical outcome (PERMANOVA p-value). Bubble plot showing DESeq results of RNA viruses (d) and expressed DNA phages (e) enriched in each clinical outcome comparisons (bubble size based on median relative abundance for those found to be statistically significant).
