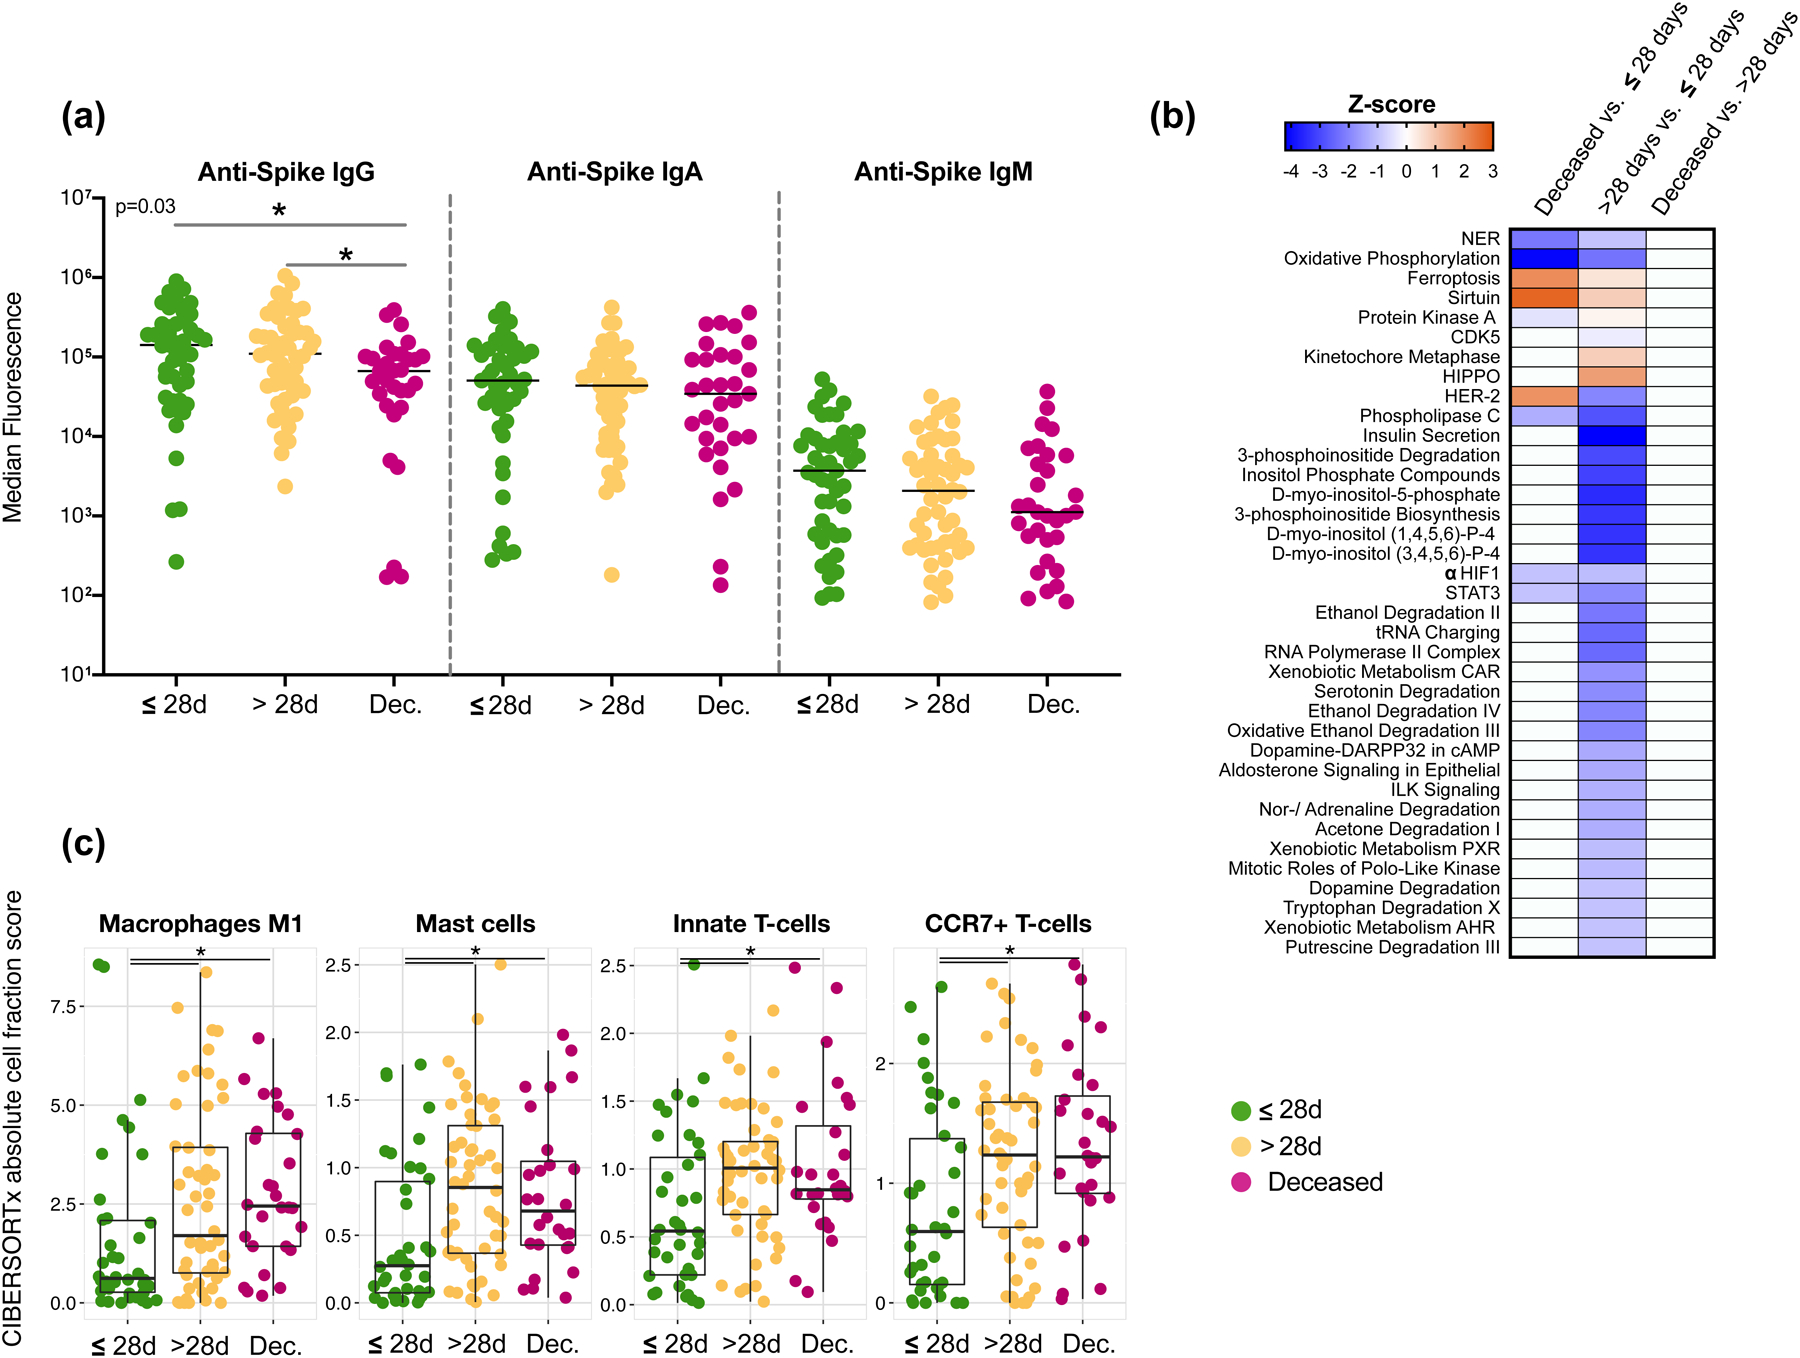
Figure 4. Lower airway host immune profiling in severely ill COVID-19.

(a) Levels of anti-SARS-CoV-2 Spike antibodies in BAL of 142 subjects (*= Two-sided Mann–Whitney U; Deceased vs <28D p=0.0133; Deceased vs >28D p=0.0213). (b) Heat-map of canonical pathway analysis based on Ingenuity Pathway Analysis (IPA, RRID:SCR_008653) using the lower airway host transcriptome comparing clinical outcome groups. Orange shows up-regulation of pathway, blue shows down-regulation of pathway. (c) Cell type abundance quantification plots. Comparison of abundance of mast cells and neutrophils among outcome groups in the BAL fluids of 118 critically ill patients with COVID-19. Cell type abundance was estimated from the host transcriptome with CIBERSORTx. Each dot denotes the quantification score of a sample while the box center depicts median, box inter-quartile range with median at the center and whiskers represent maximum and minimum (*=Two-sided Mann–Whitney U; Macrophages: M1 >28D vs <28D p=0.017; Deceased vs <28D p=0.0014; Mast Cells: >28D vs <28D p=0.0013; Deceased vs <28D p=0.0056; Innate T-Cells: >28D vs <28D p=0.0071; Deceased vs <28D p=0.0068; CCR7+ T-cells: >28D vs <28D p=0.0192; Deceased vs <28D p=0.0068).
