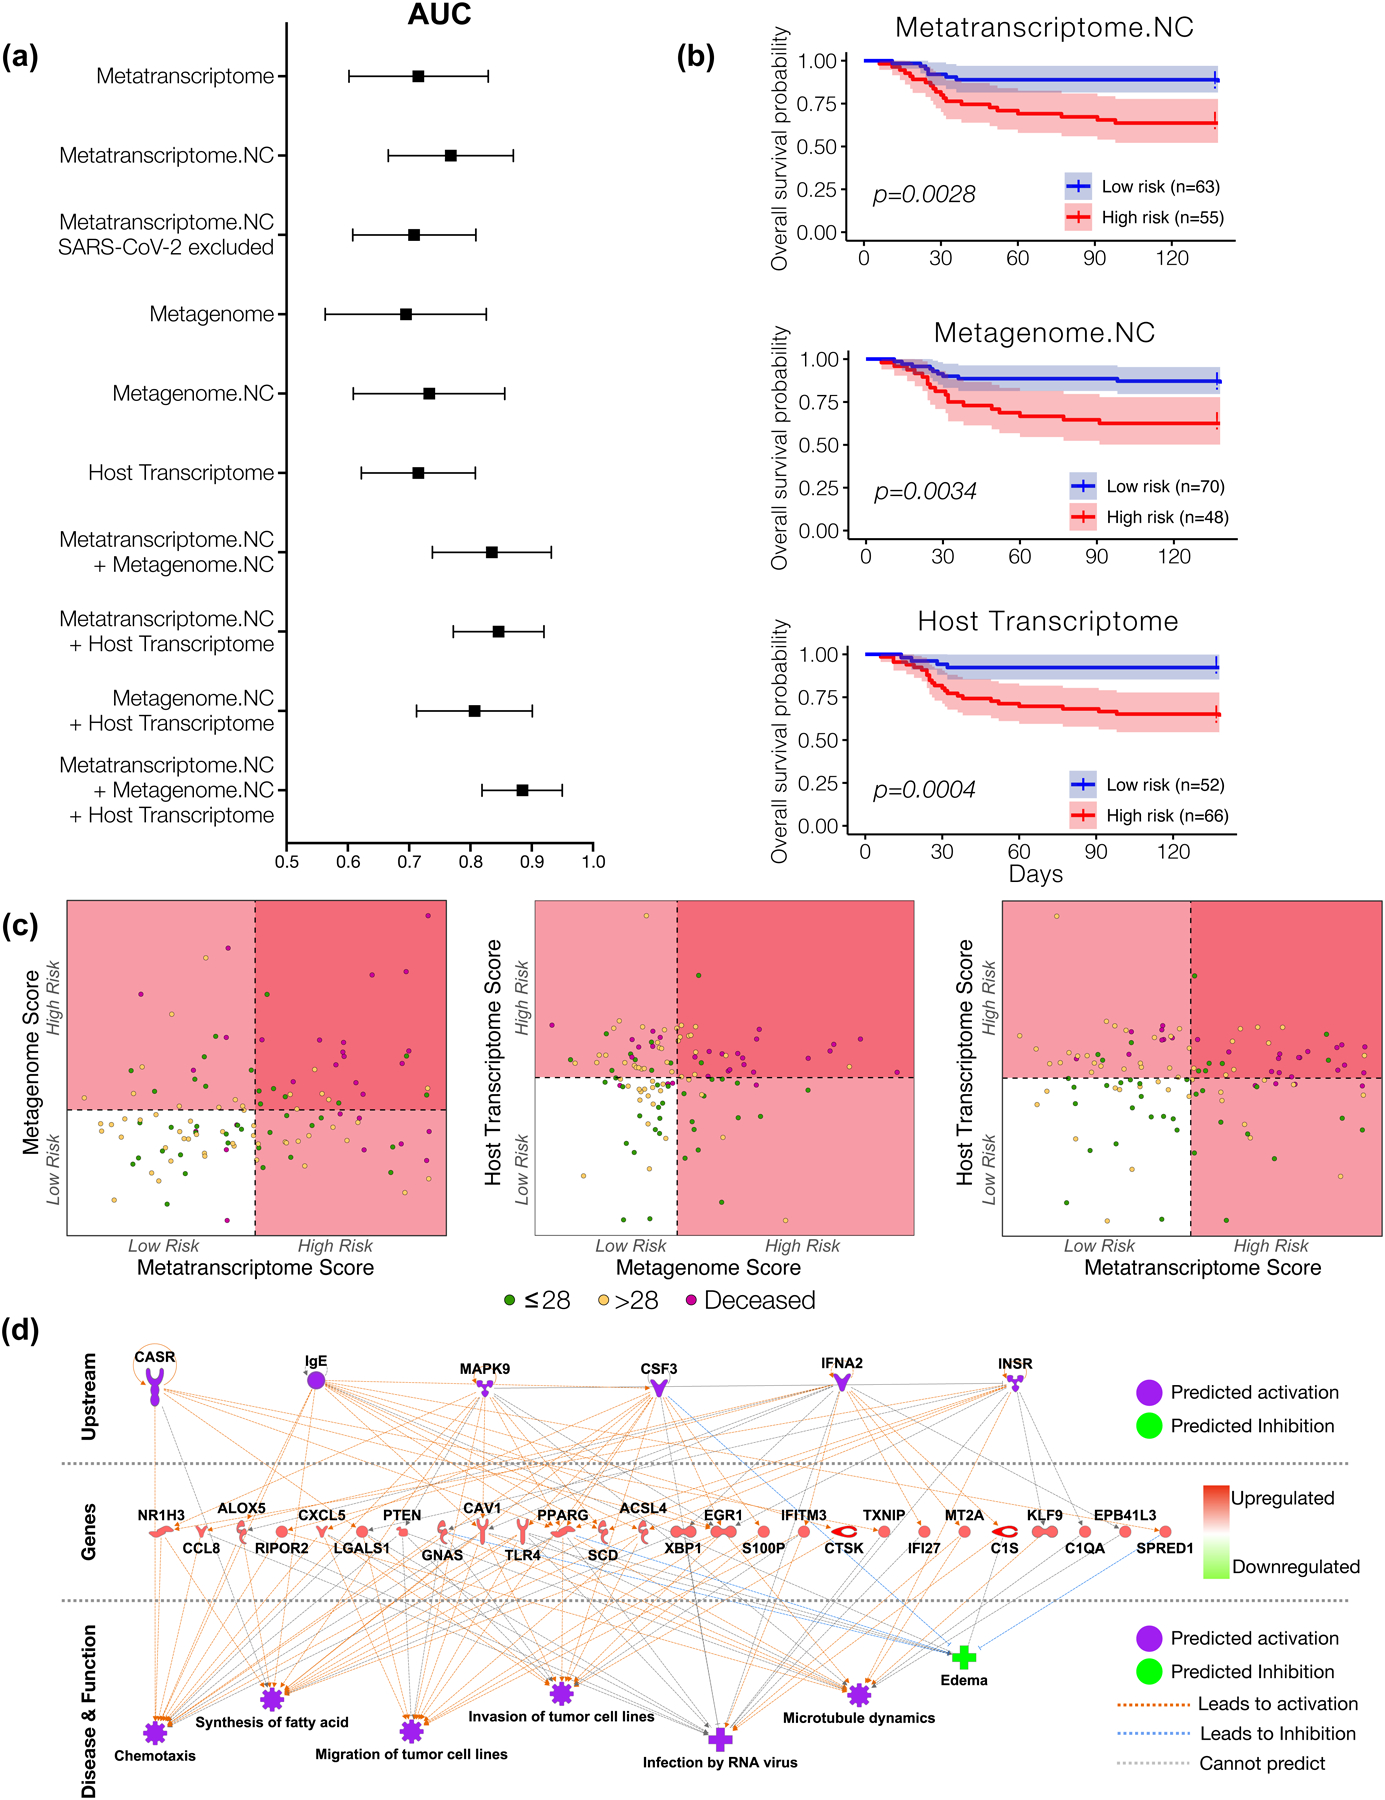
Figure 5. Mortality predictive power of metatranscriptome, metagenome and host transcriptome.

(a) Area under the curve median and 95% confidence interval for receiver operating characteristic curve analyses calculated from each sequencing datasets as predictor and mortality (death time from ICU admission) as outcome from 118 subjects. (b) Kaplan-meier survival analyses with 95% confidence interval based on a cutoff value estimated from features selected from each sequencing dataset. The “High risk” and “Low risk” groups is the mean of predicted risk scores in all samples (p value with Matel Cox). (c) Scatterplot among risk scores from metatranscriptome, metagenome, and host transcriptome. Dotted line denotes the mean of the risk scores across all subjects, which is also the threshold for dividing the samples into “High risk” and “Low risk” groups. (d) IPA analyses of host transcriptomic signatures identified as most predictive of mortality.
