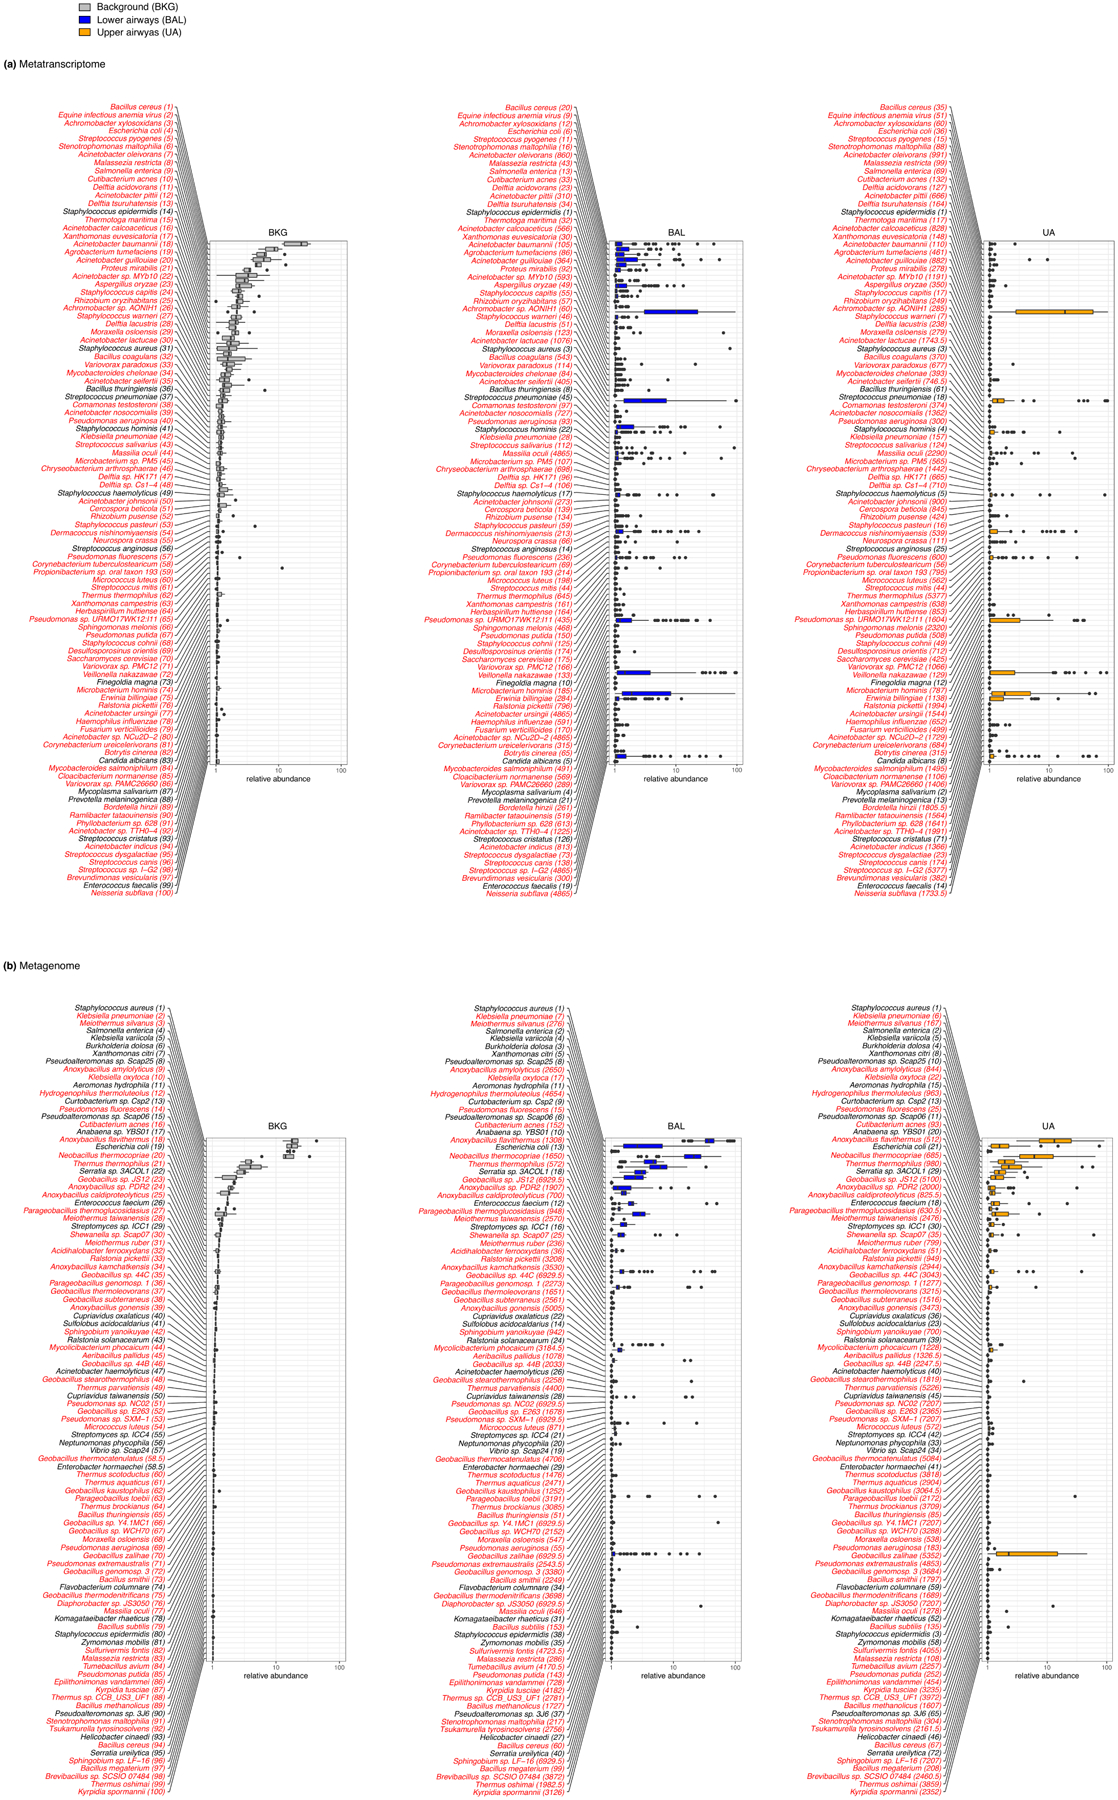
Extended Data Fig. 2. Identification of top taxa found in background samples as compared with BAL and upper airway samples.

Boxplots showing the relative abundance values in log10 relative abundance of taxa ranked ordered based on dominance of Background bronchoscope control samples and compared to abundances in BAL and Upper Airway samples within metatranscriptome (a) and metagenome (b) data. Red labels indicate taxa where relative abundance is higher in background samples than in BAL and therefore considered possible contaminant.
