
Extended Data Fig. 3. Topographical analyses of metatranscriptome data.
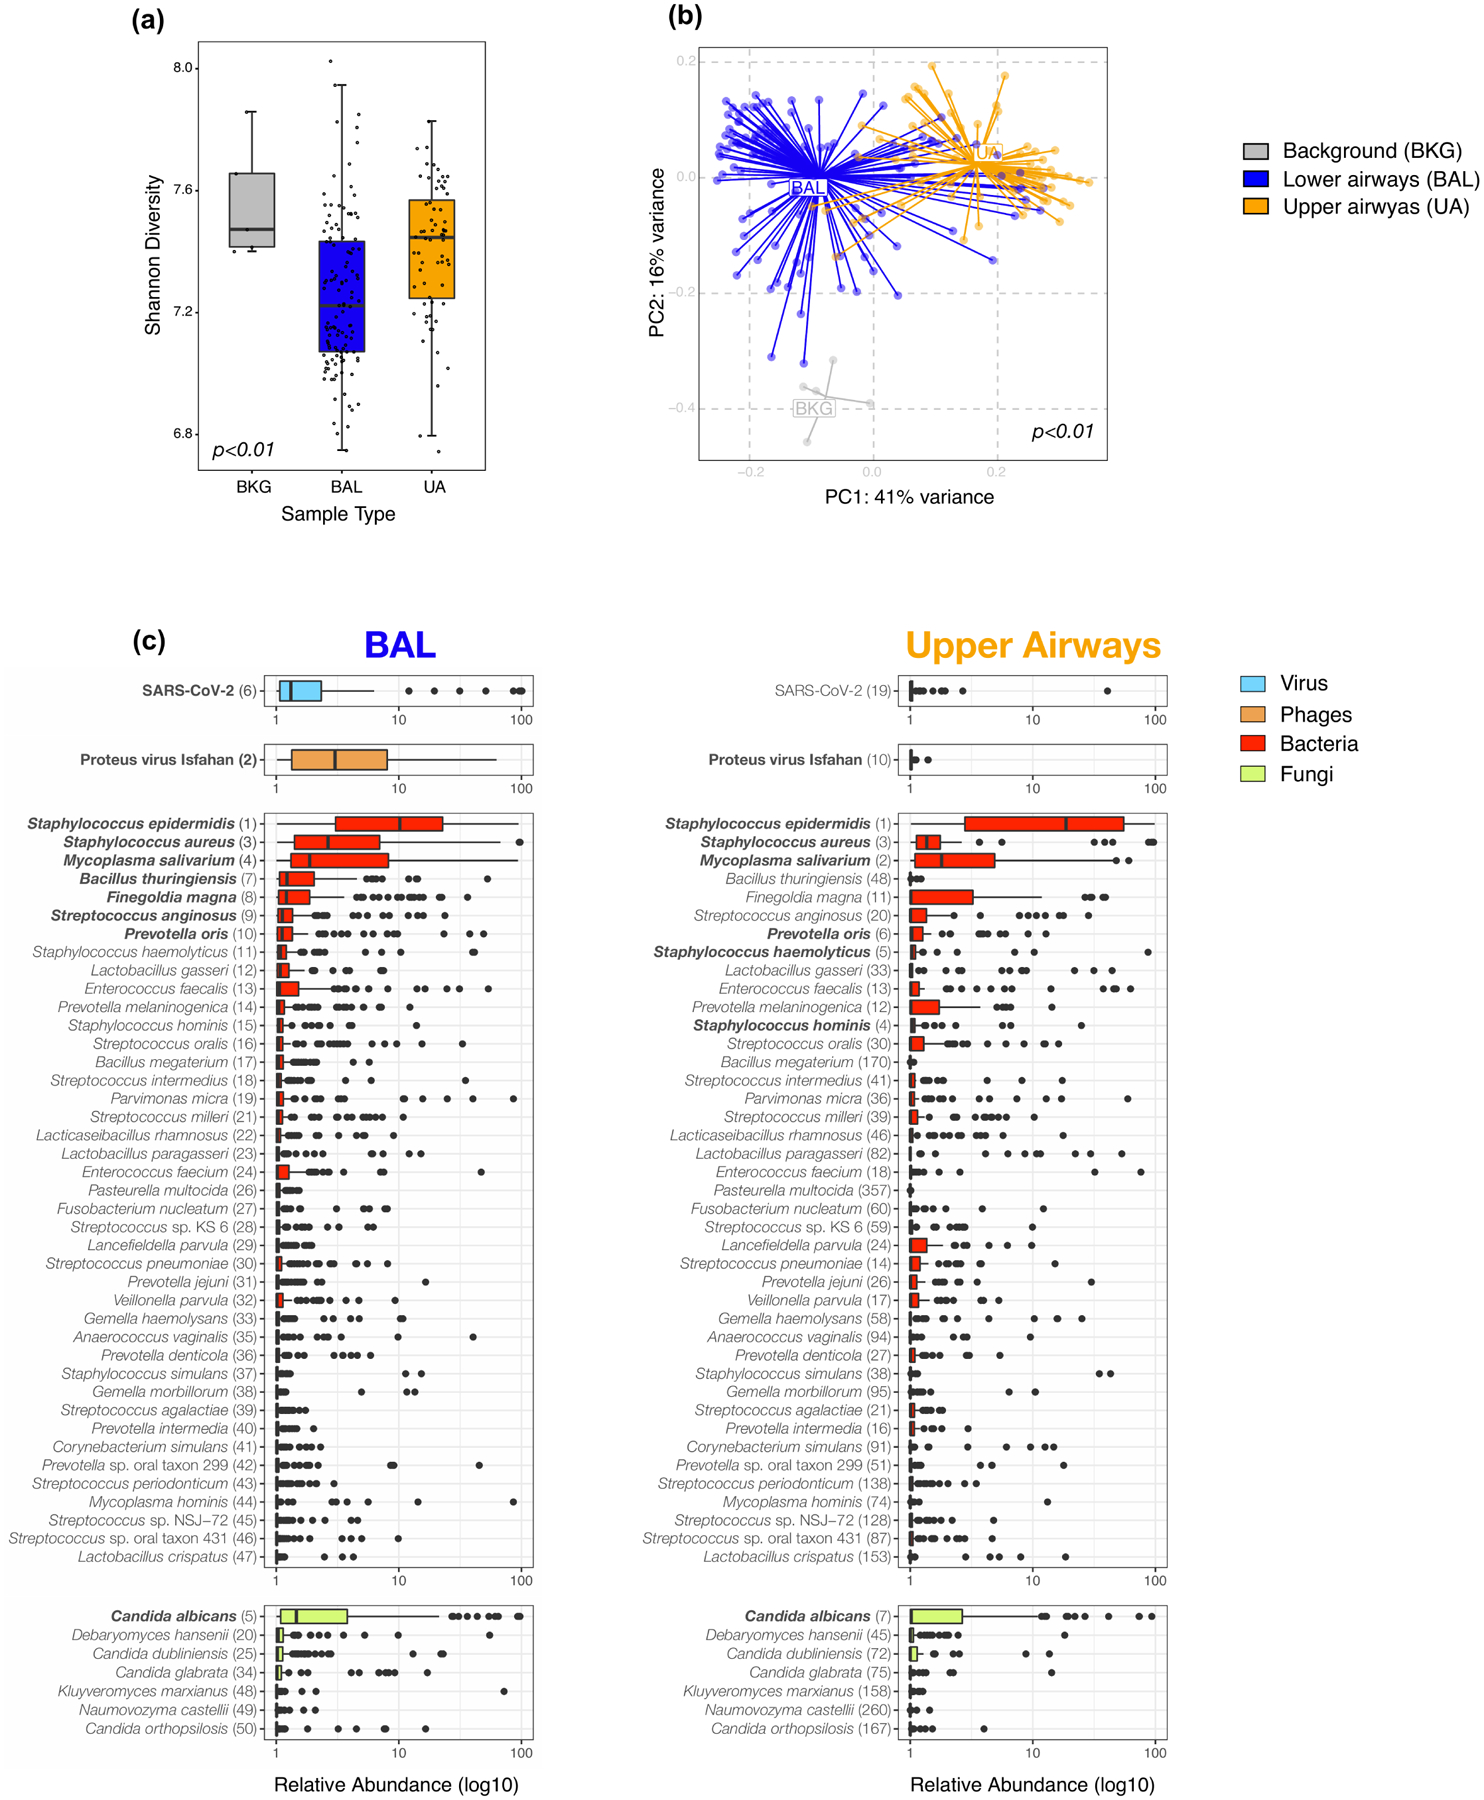
a) Comparison of alpha diversity (Shannon Index, each dot denotes the Shannon diversity of a sample while the box center depicts median, box interquartile range with median at the center and whiskers represent maximum and minimum value) and b) beta diversity (Bray Curtis Dissimilarity index, across 5 background negative controls (bronchoscope), 118 bronchoalveolar lavage (BAL) and 64 upper airway (UA) samples (Kruskal-Wallis p value =0.0006 and PERMANOVA p-values = 0.001, without multiple comparisons, respectively). (c) Boxplots showing the relative abundance values in log10 across all metatranscriptome samples for the 118 BAL and 64 Upper Airway samples. The 50 taxa with the highest relative abundance values in the BAL metatranscriptome data are displayed; the top 10 in the BAL are highlighted in bold. Each column consists of four plots displaying in decreasing order of abundance the top RNA vertebrate viruses, DNA phages, bacteria, and fungi identified (from top to bottom). Numbers in parentheses next to the taxa labels display the ranking in relative abundance for either the BAL or UA metatranscriptome samples, respectively. Each dot denotes the relative abundance of a taxa per sample while the box center depicts median, box inter-quartile range with median at the center and whiskers represent maximum and minimum value.