
Figure 1. FMRP regulates cortical neurogenesis in a human forebrain organoid model.
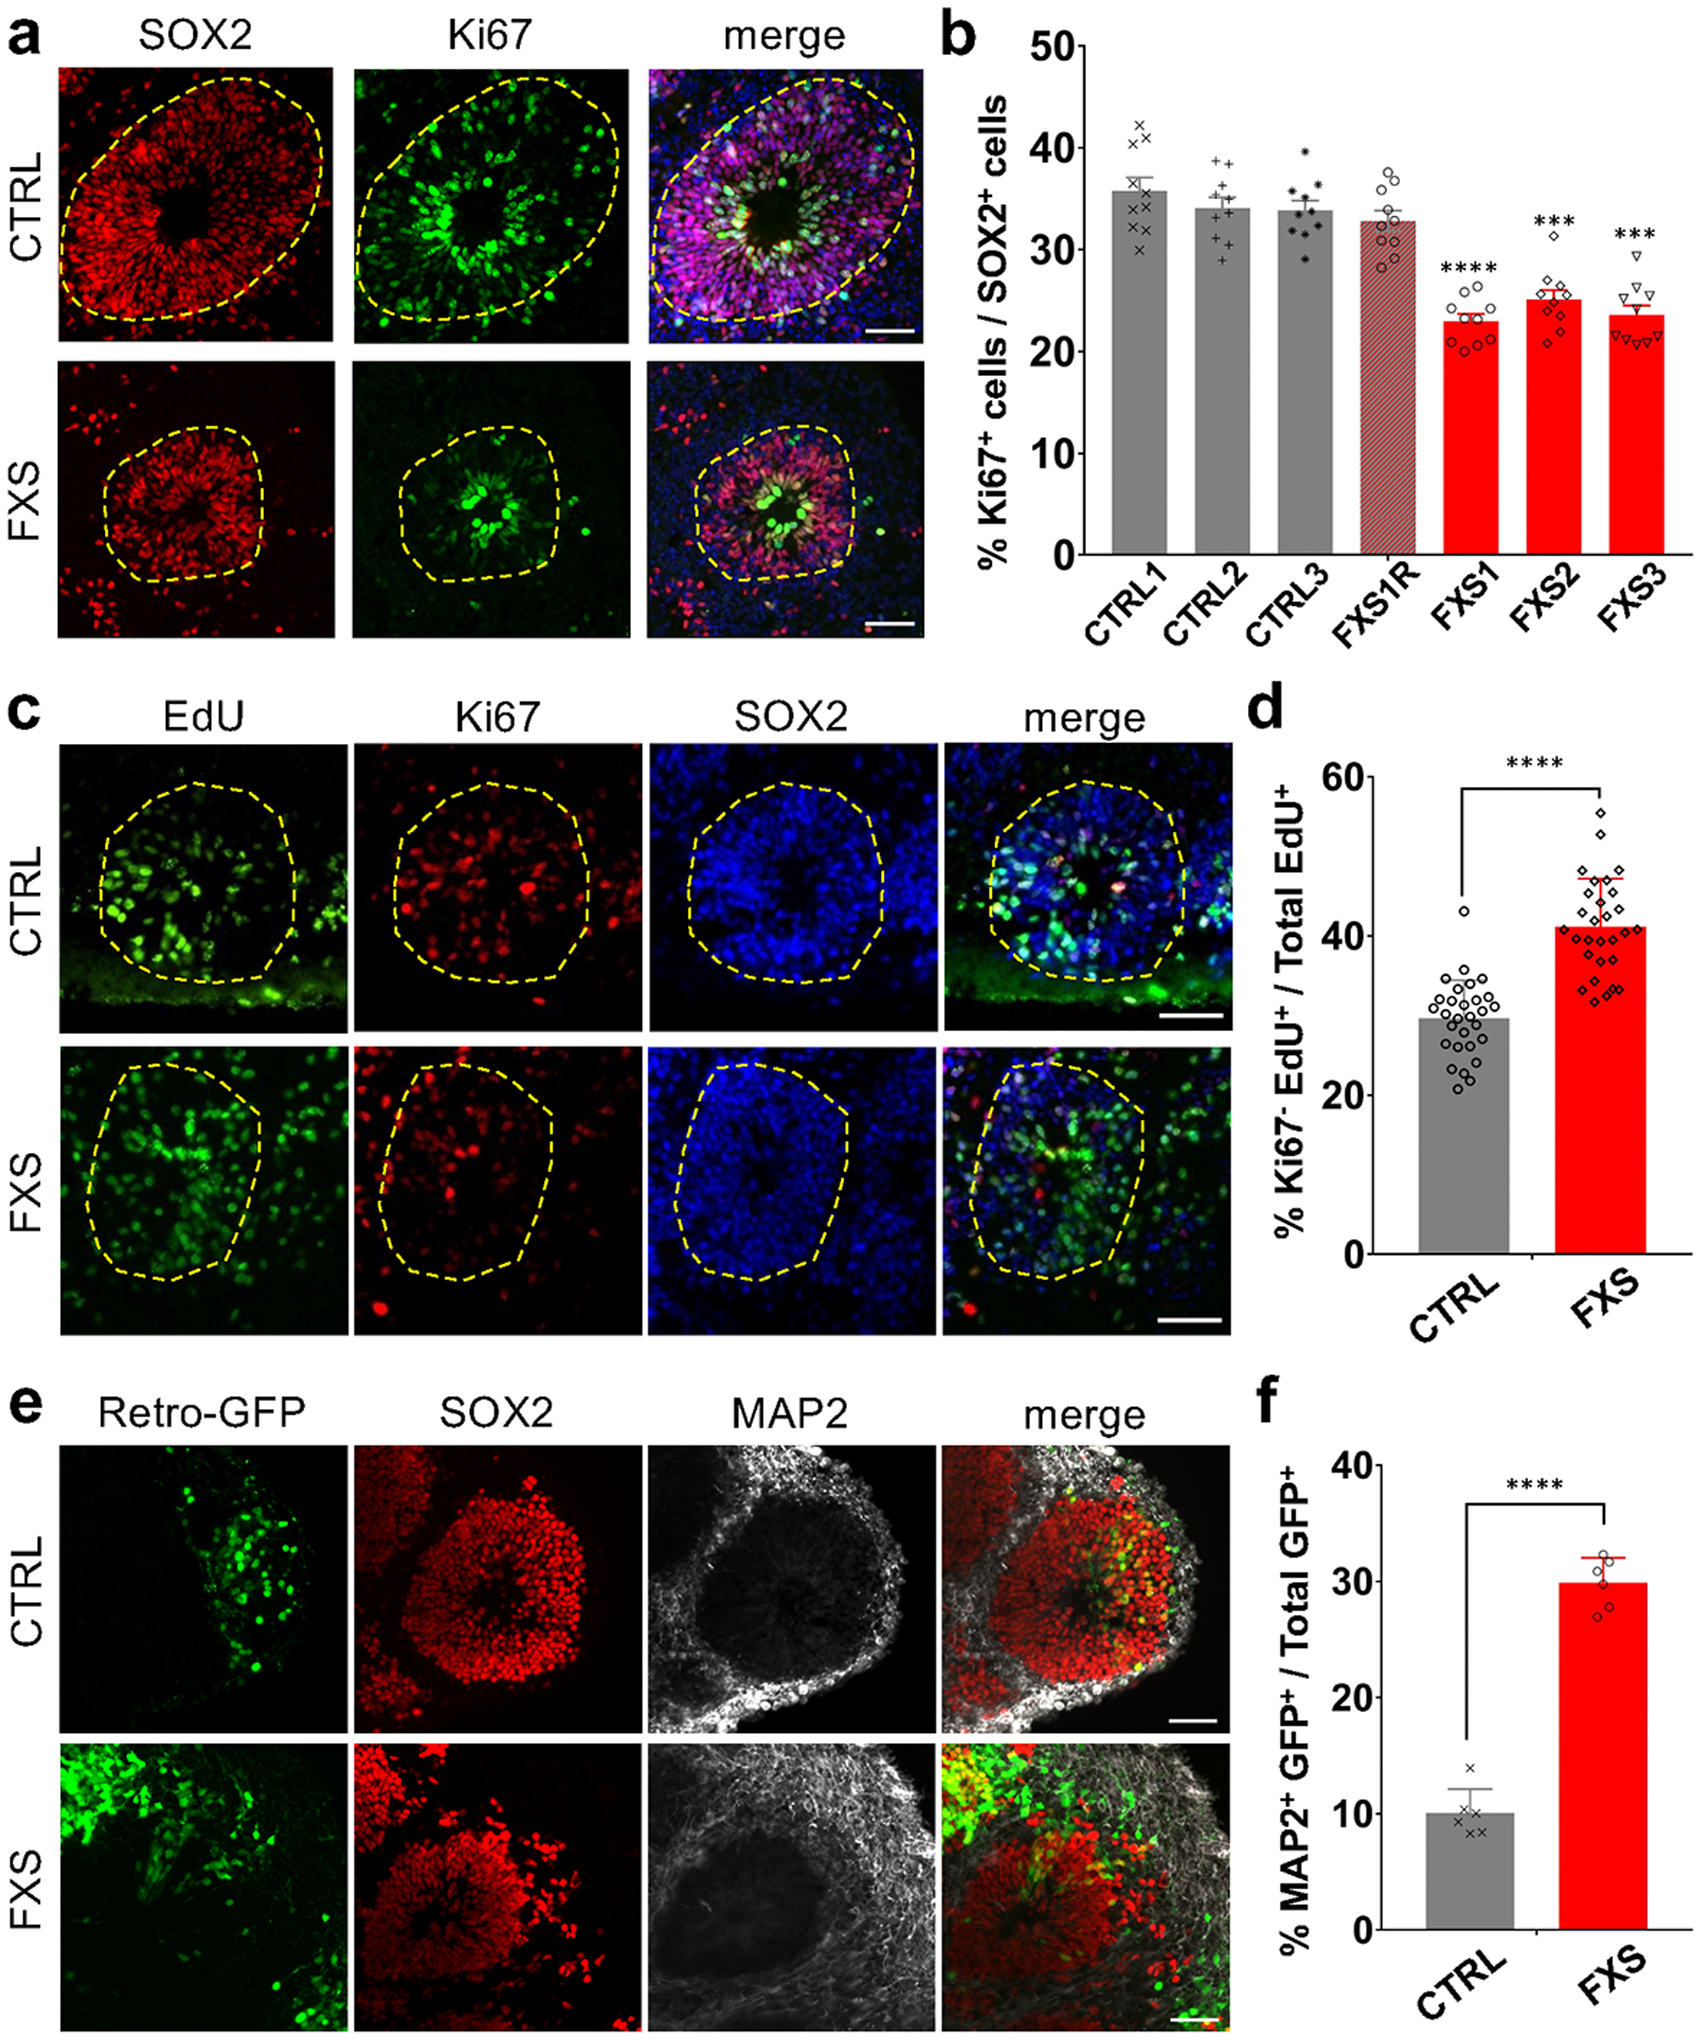
(a-b) Loss of FMRP reduces NPC proliferation. Shown are representative images (a) and stereological quantification (b) of the proportion of Ki67+ proliferating neuronal progenitor cells in both control and FXS-derived forebrain organoids at day 56. Yellow dashed lines indicate the borders of VZ-like structures. Data are presented as mean ± s.e.m. (n = 10 organoids from each line with 15–20 cortical structures analyzed per organoid; ***P = 0.0002 (FXS2 v.s. CTRL1) or 0.0001 (FXS3 v.s. CTRL1), ****P < 0.0001 (FXS1 v.s. CTRL1), one-way ANOVA). Scale bars: 50 μm. (c-d) FMRP deficiency accelerates NPC cell cycle exit during the 24-hour EdU exposure in FXS forebrain organoids. Shown are representative images (c) and quantification (d) of the proportion of Ki67− NPCs in total EdU+ cells in both control and FXS-derived forebrain organoids after 24-hour EdU exposure. Yellow dashed lines indicate the borders of VZ-like structures. Data are presented as mean ± s.e.m. (n = 29 cortical structures from at least ten organoids each condition; ****P < 0.0001, one sided student’s t-test). Scale bars: 50 μm. (e-f) Loss of FMRP accelerates neural differentiation. Day 49 control and FXS forebrain organoids were infected with retroviruses expressing GFP and analyzed 7 days later (day 56). Shown are sample images for immunostaining for GFP, SOX2 and MAP2 (e) and quantifications of percentages of MAP2+GFP+ cells among all GFP+ cells (f). Values represent mean ± s.e.m. (n = 6 organoids from control or FXS lines each with 10–12 cortical structures analyzed per organoid; ****p < 0.0001; one sided student’s t test). Scale bars: 50 μm.