
Extended Data Fig. 5. Basic electrophysiological characterization of FXS neurons in forebrain organoids.
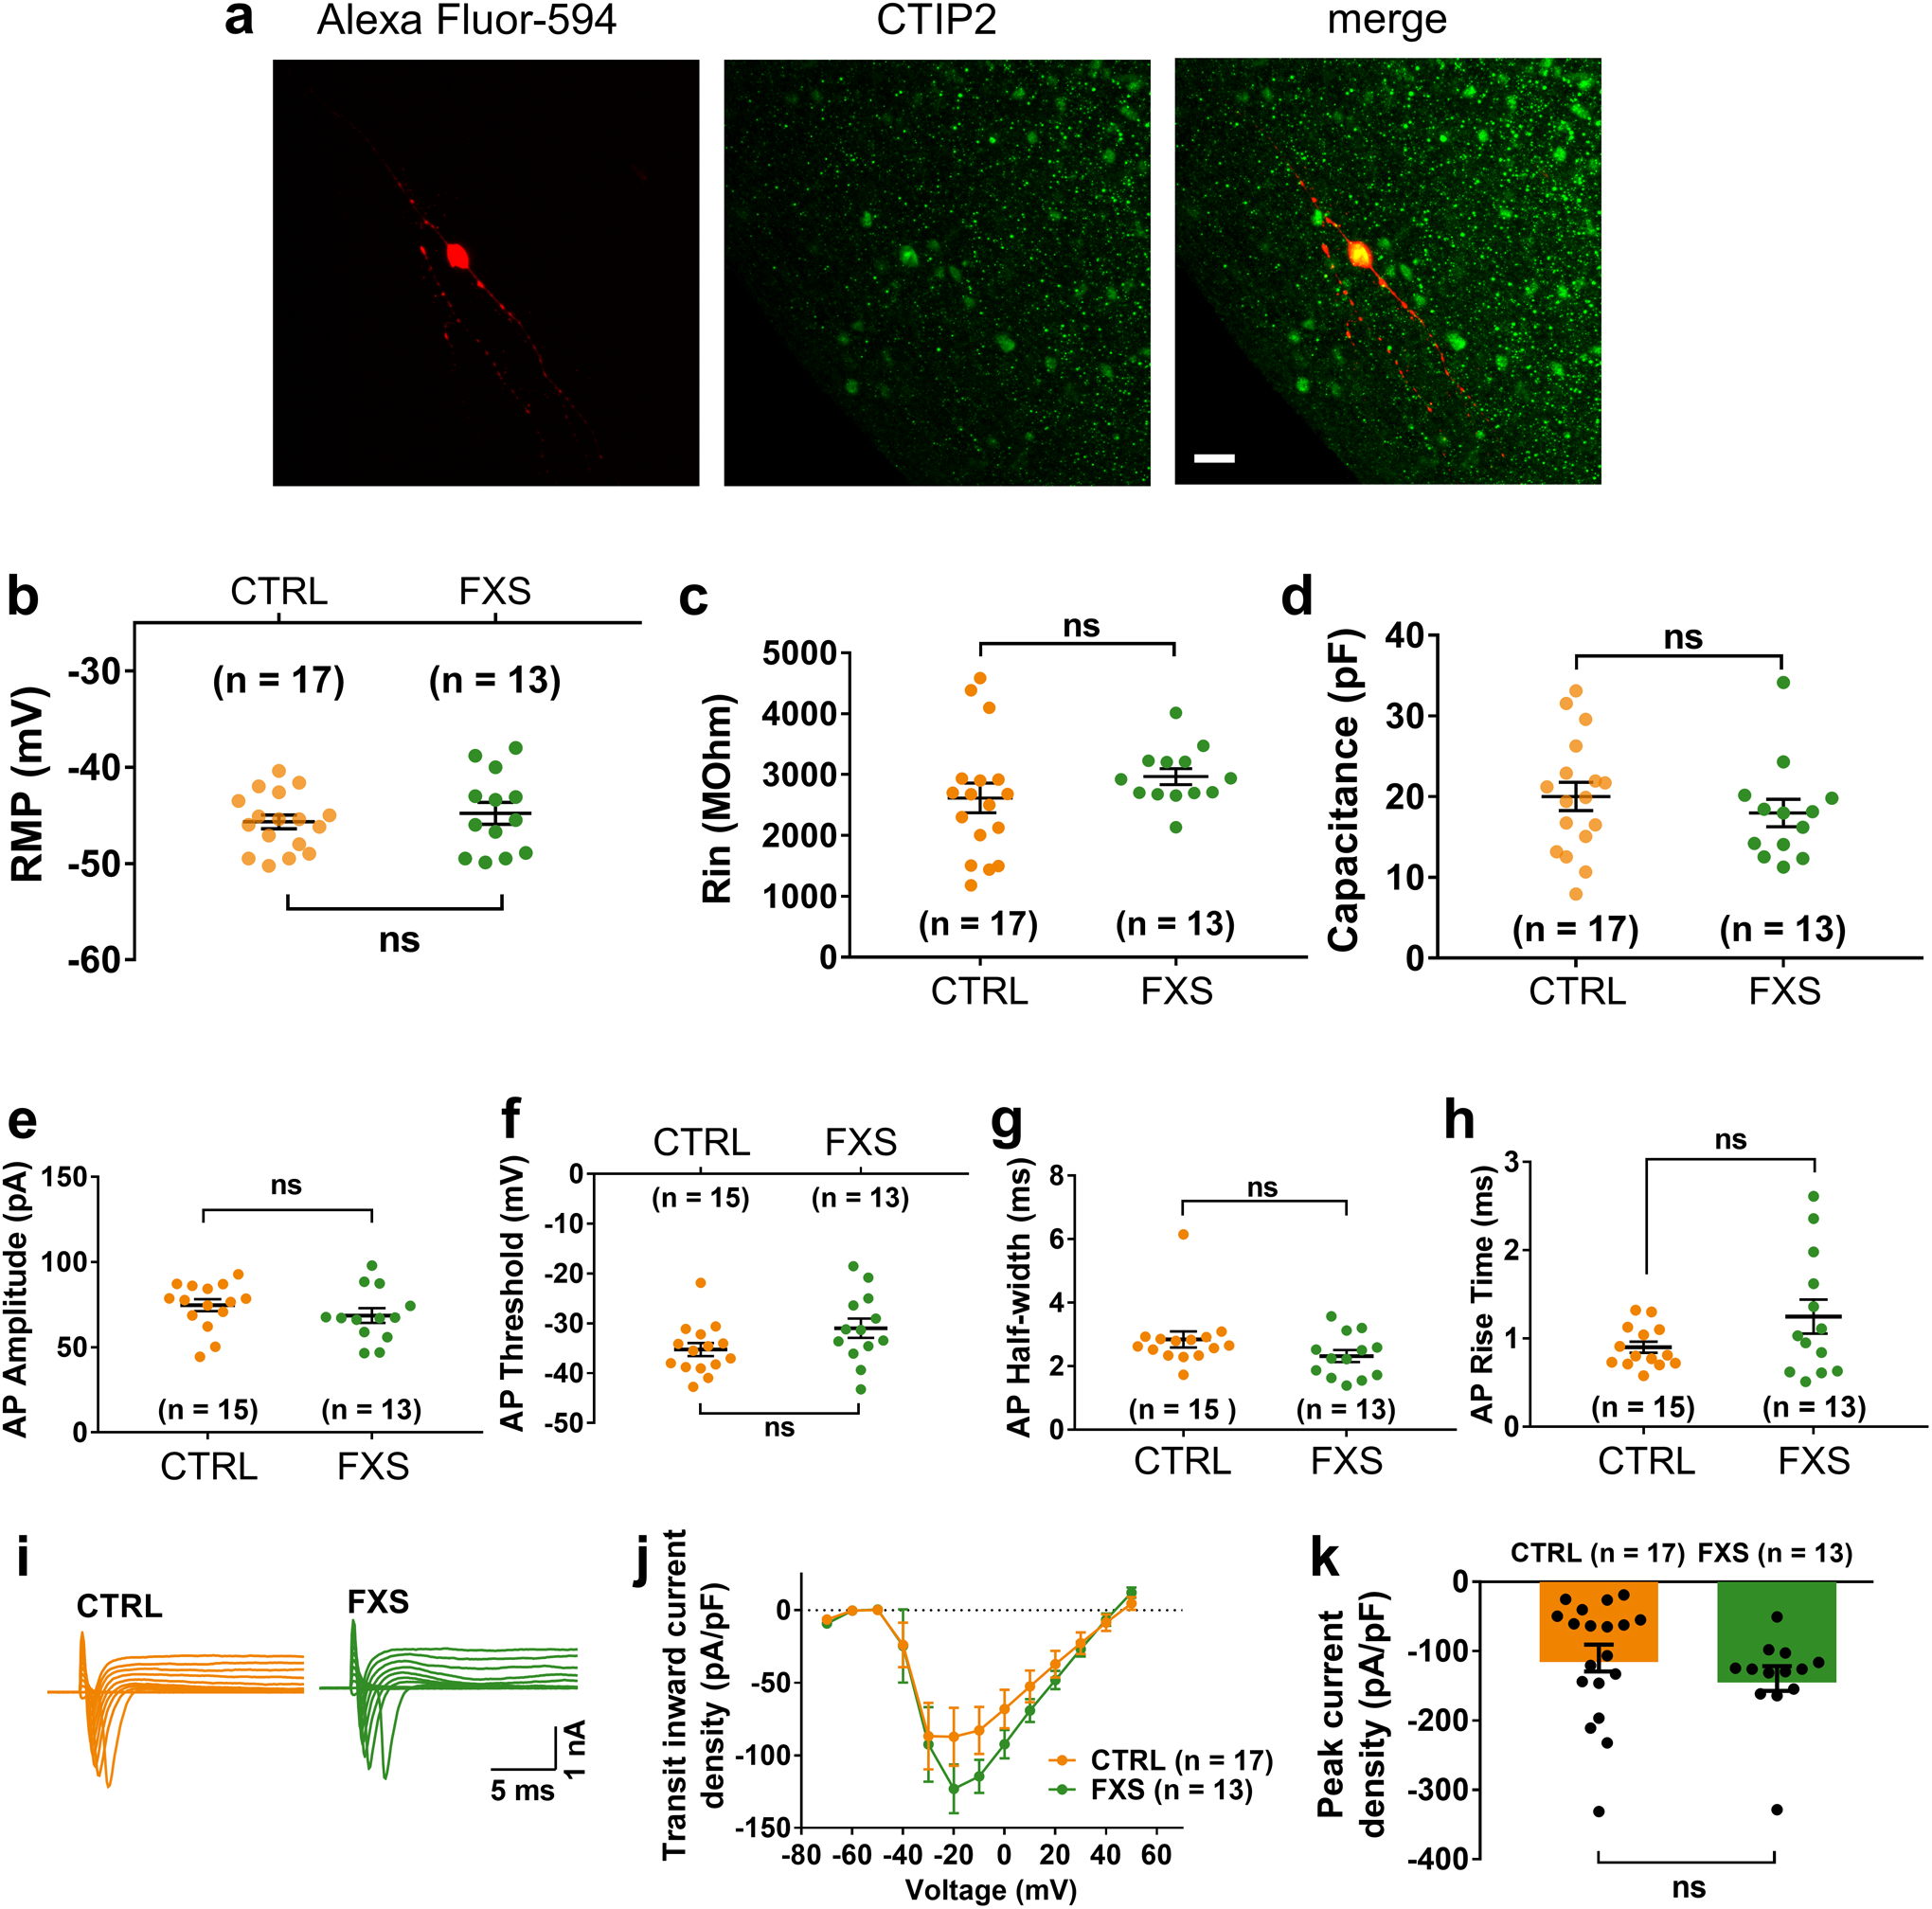
(a) Shown are sample images of a CTIP2+ cortical neurons that was filled with Alexa Fluor-594 dye after the electrophysiological recording. Scale bars: 20 μm. Experiment was repeated at least 13 times independently for each condition with similar results. (b-d) Characterization of passive membrane properties, including the resting membrane potential (RMP; b), input resistance (RIN; c), and membrane capacitance (d). Data are presented as mean ± s.e.m. (two-tailed unpaired t test or one-way ANOVA). (e-h) Basic properties of action potentials, including the amplitude (e), threshold (f), half-width (g), and the rise time (h) of the first action potentials. Data are presented as mean ± s.e.m. (two-tailed unpaired t test or one-way ANOVA). (i-k) Characterization of transient inward currents and sustained outward currents of FXS neurons. Shown are sample tracings of transient inward and sustained outward currents (i), quantification of transient inward current-voltage curve (j) and peak density of transient inward currents (k). Data are presented as mean ± s.e.m. (two-tailed unpaired t test or one-way ANOVA). Cell number (n) recorded and analyzed in each condition is indicated.