
Figure 2. Loss of FMRP impairs cortical neurodevelopment.
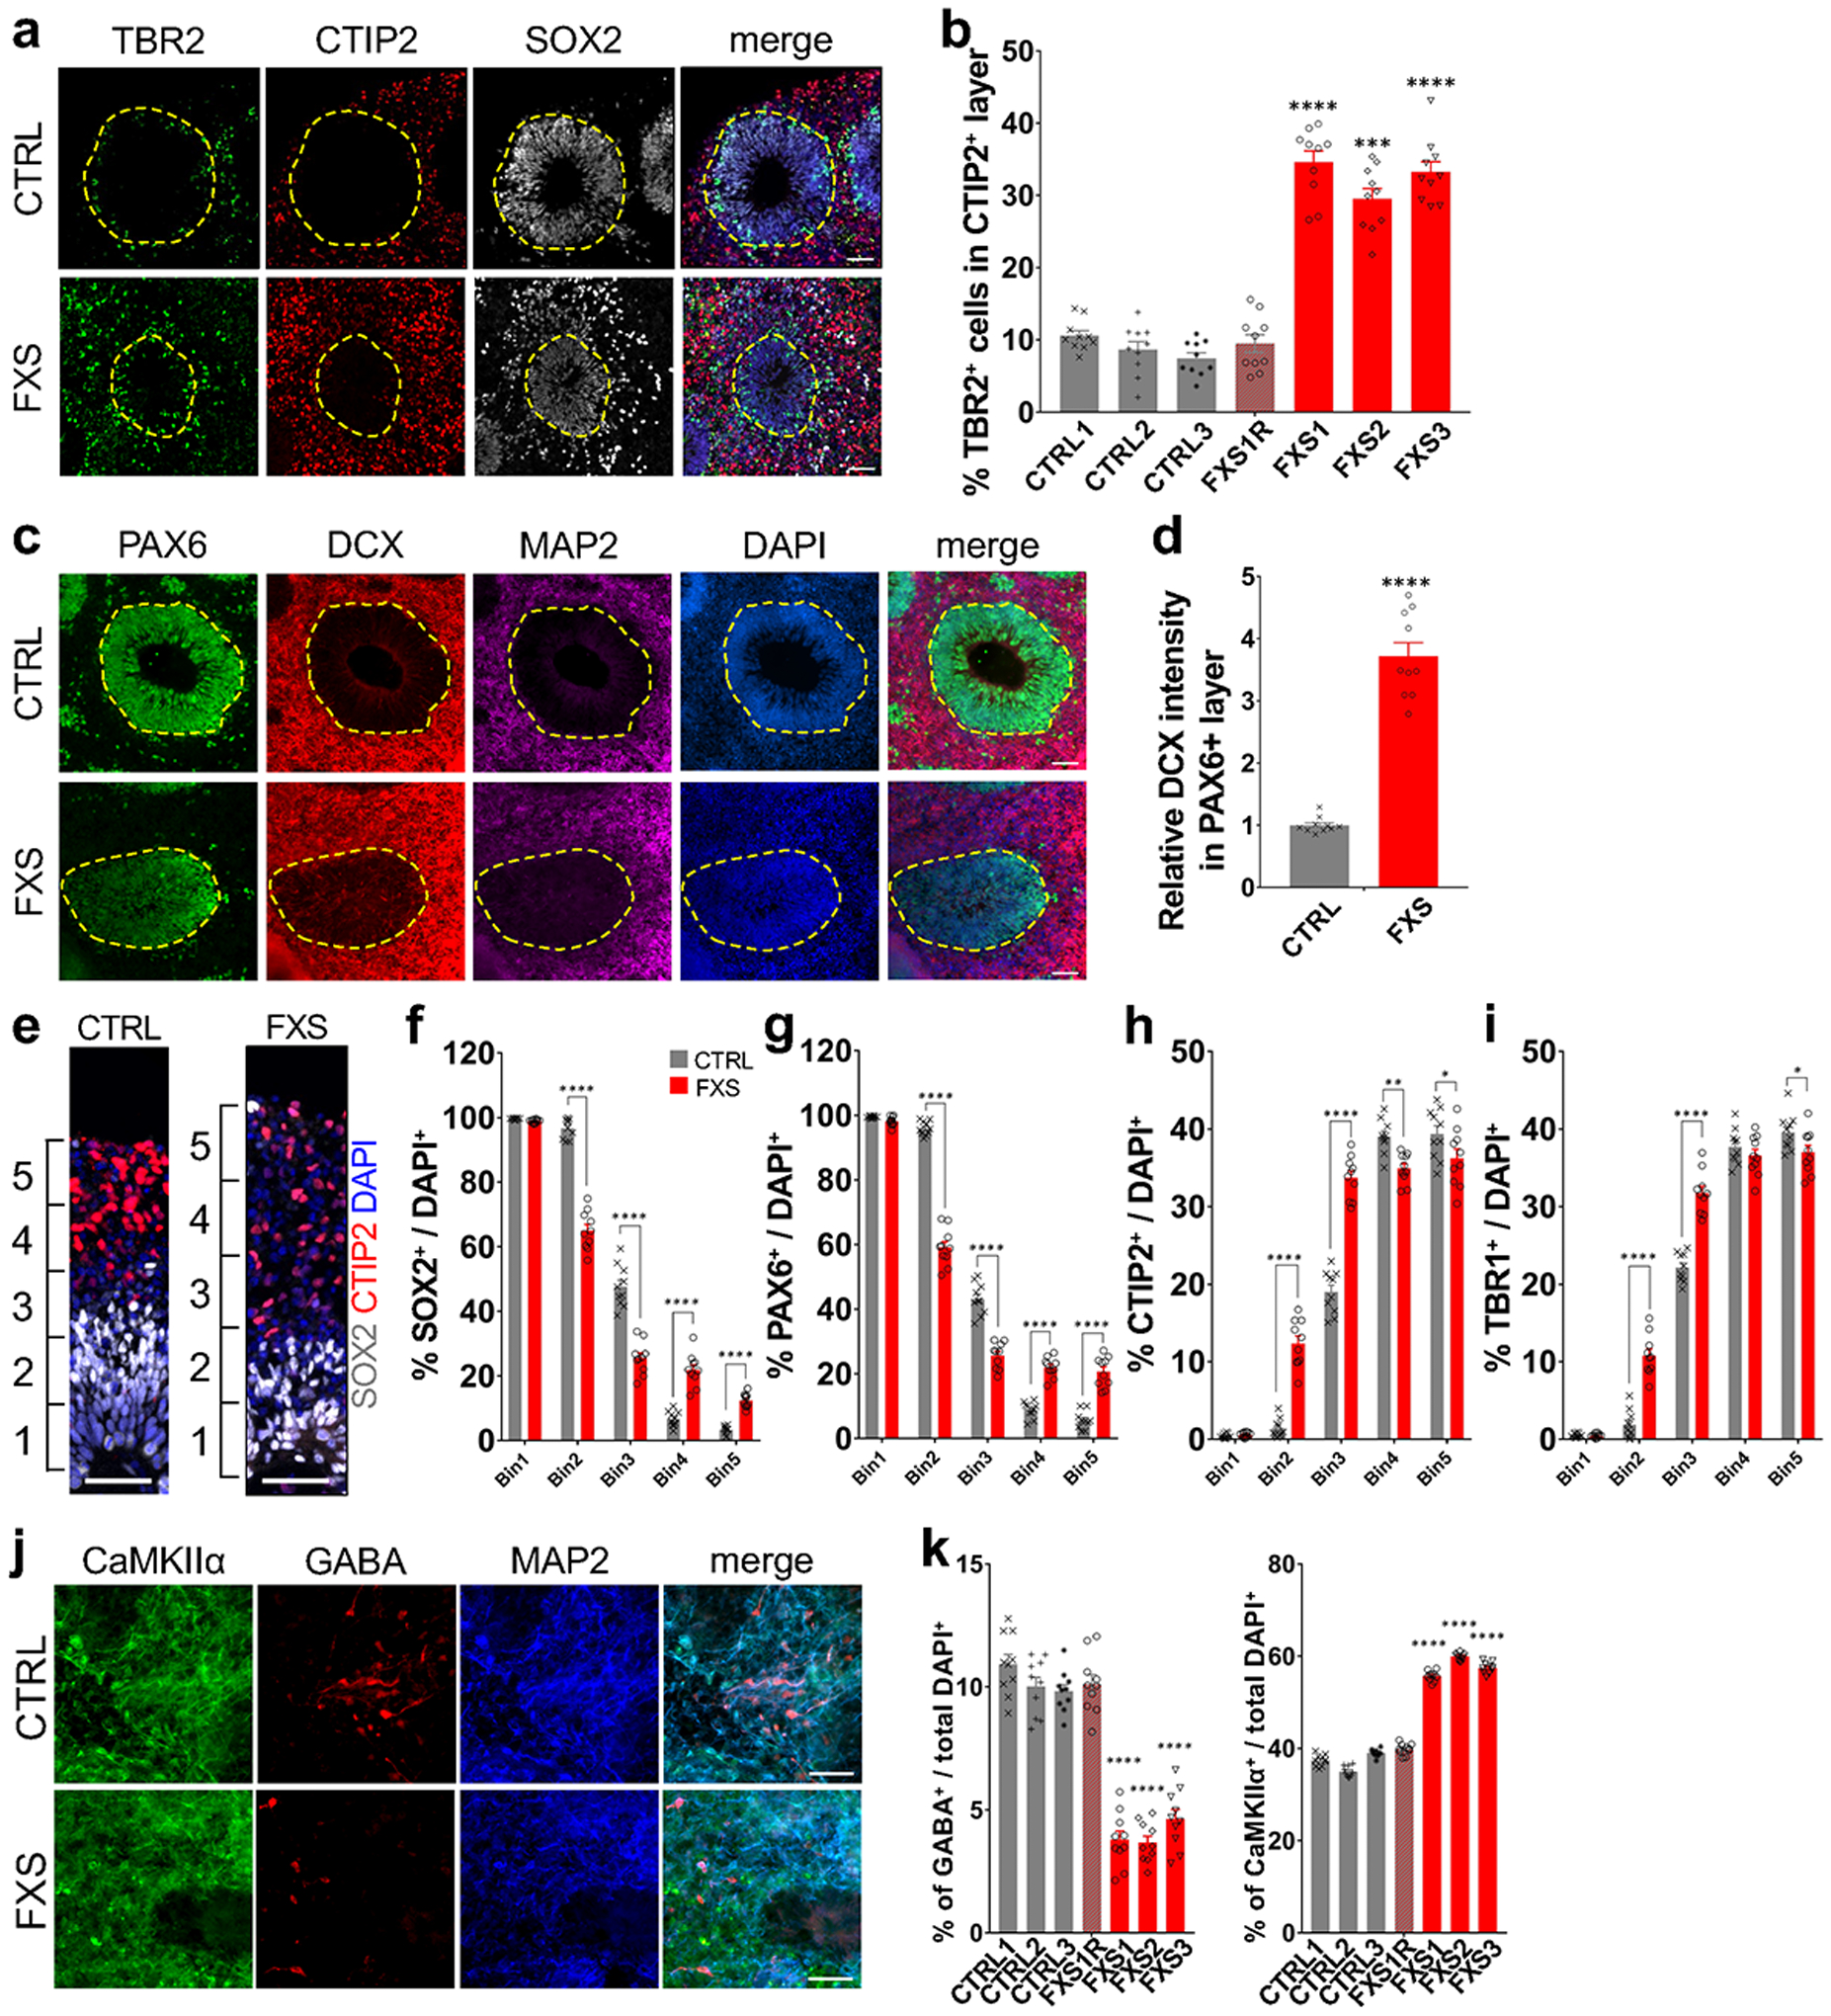
(a-b) Loss of FMRP dysregulates distribution of TBR2+ intermediate neural progenitor cells. Shown are representative images (a) and quantification (b) of the proportion of TBR2+ IPCs in CTIP2+ layer of both control and FXS-derived forebrain organoids. Yellow dashed lines indicate the borders of VZ-like structures. Data are presented as mean ± s.e.m. (n = 10 organoids from each line with 15–20 cortical structures analyzed per organoid; *** P = 0.0001, ****P < 0.0001, one-way ANOVA). Scale bars: 50 μm. (c-d) FMRP deficiency induces premature neural differentiation. Shown are sample images for immunostaining for PAX6, DCX, and MAP2 (c) and quantifications of relative expression level of DCX in PAX6+ NPCs in the VZ-like structures (d). Yellow dashed lines indicate the borders of VZ-like structures. Values represent mean ± s.e.m. (n = 10 organoids from control or FXS lines each with 15–20 cortical structures analyzed per organoid; ****p < 0.0001; one sided student’s t test). Scale bars: 50 μm. (e-i) Loss of FMRP alters cortical layer formation. Shown in (e) are sample images of the expanded neuroepithelium in D56 control and FXS organoids stained with SOX2 and CTIP2. Scale bars: 50 μm. Shown in (f-i) are quantifications of distributions of SOX2 (f), PAX6 (g), CTIP2 (h), and TBR1 (i) in the entire span of the neuroepithelium which was divided into five equal portions (bins). Data are presented as mean ± s.e.m. (n = 10 organoids from control or FXS lines each with 15–20 cortical structures analyzed per organoid; *p = 0.0240 (h) or 0.0488 (i), **p = 0.0014 (h), ****p < 0.0001; one-way ANOVA). (j-k) Loss of FMRP prevents differentiation of GABAergic interneurons. Shown are sample images for immunostaining for CaMKIIα, GABA, and MAP2 (g) and quantification (h) of percentages of GABA+ inhibitory neurons (left) and CaMKIIα+ excitatory neurons (right) in total DAPI+ cells in both control and FXS-derived forebrain organoids. Data are presented as mean ± s.e.m. (n = 10 sections from 10 organoids each line; ****P < 0.0001, one-way ANOVA). Scale bars: 50 μm.