
Figure 5. Lack of FMRP causes altered neural differentiation and aberrant developmental trajectory in forebrain organoids.
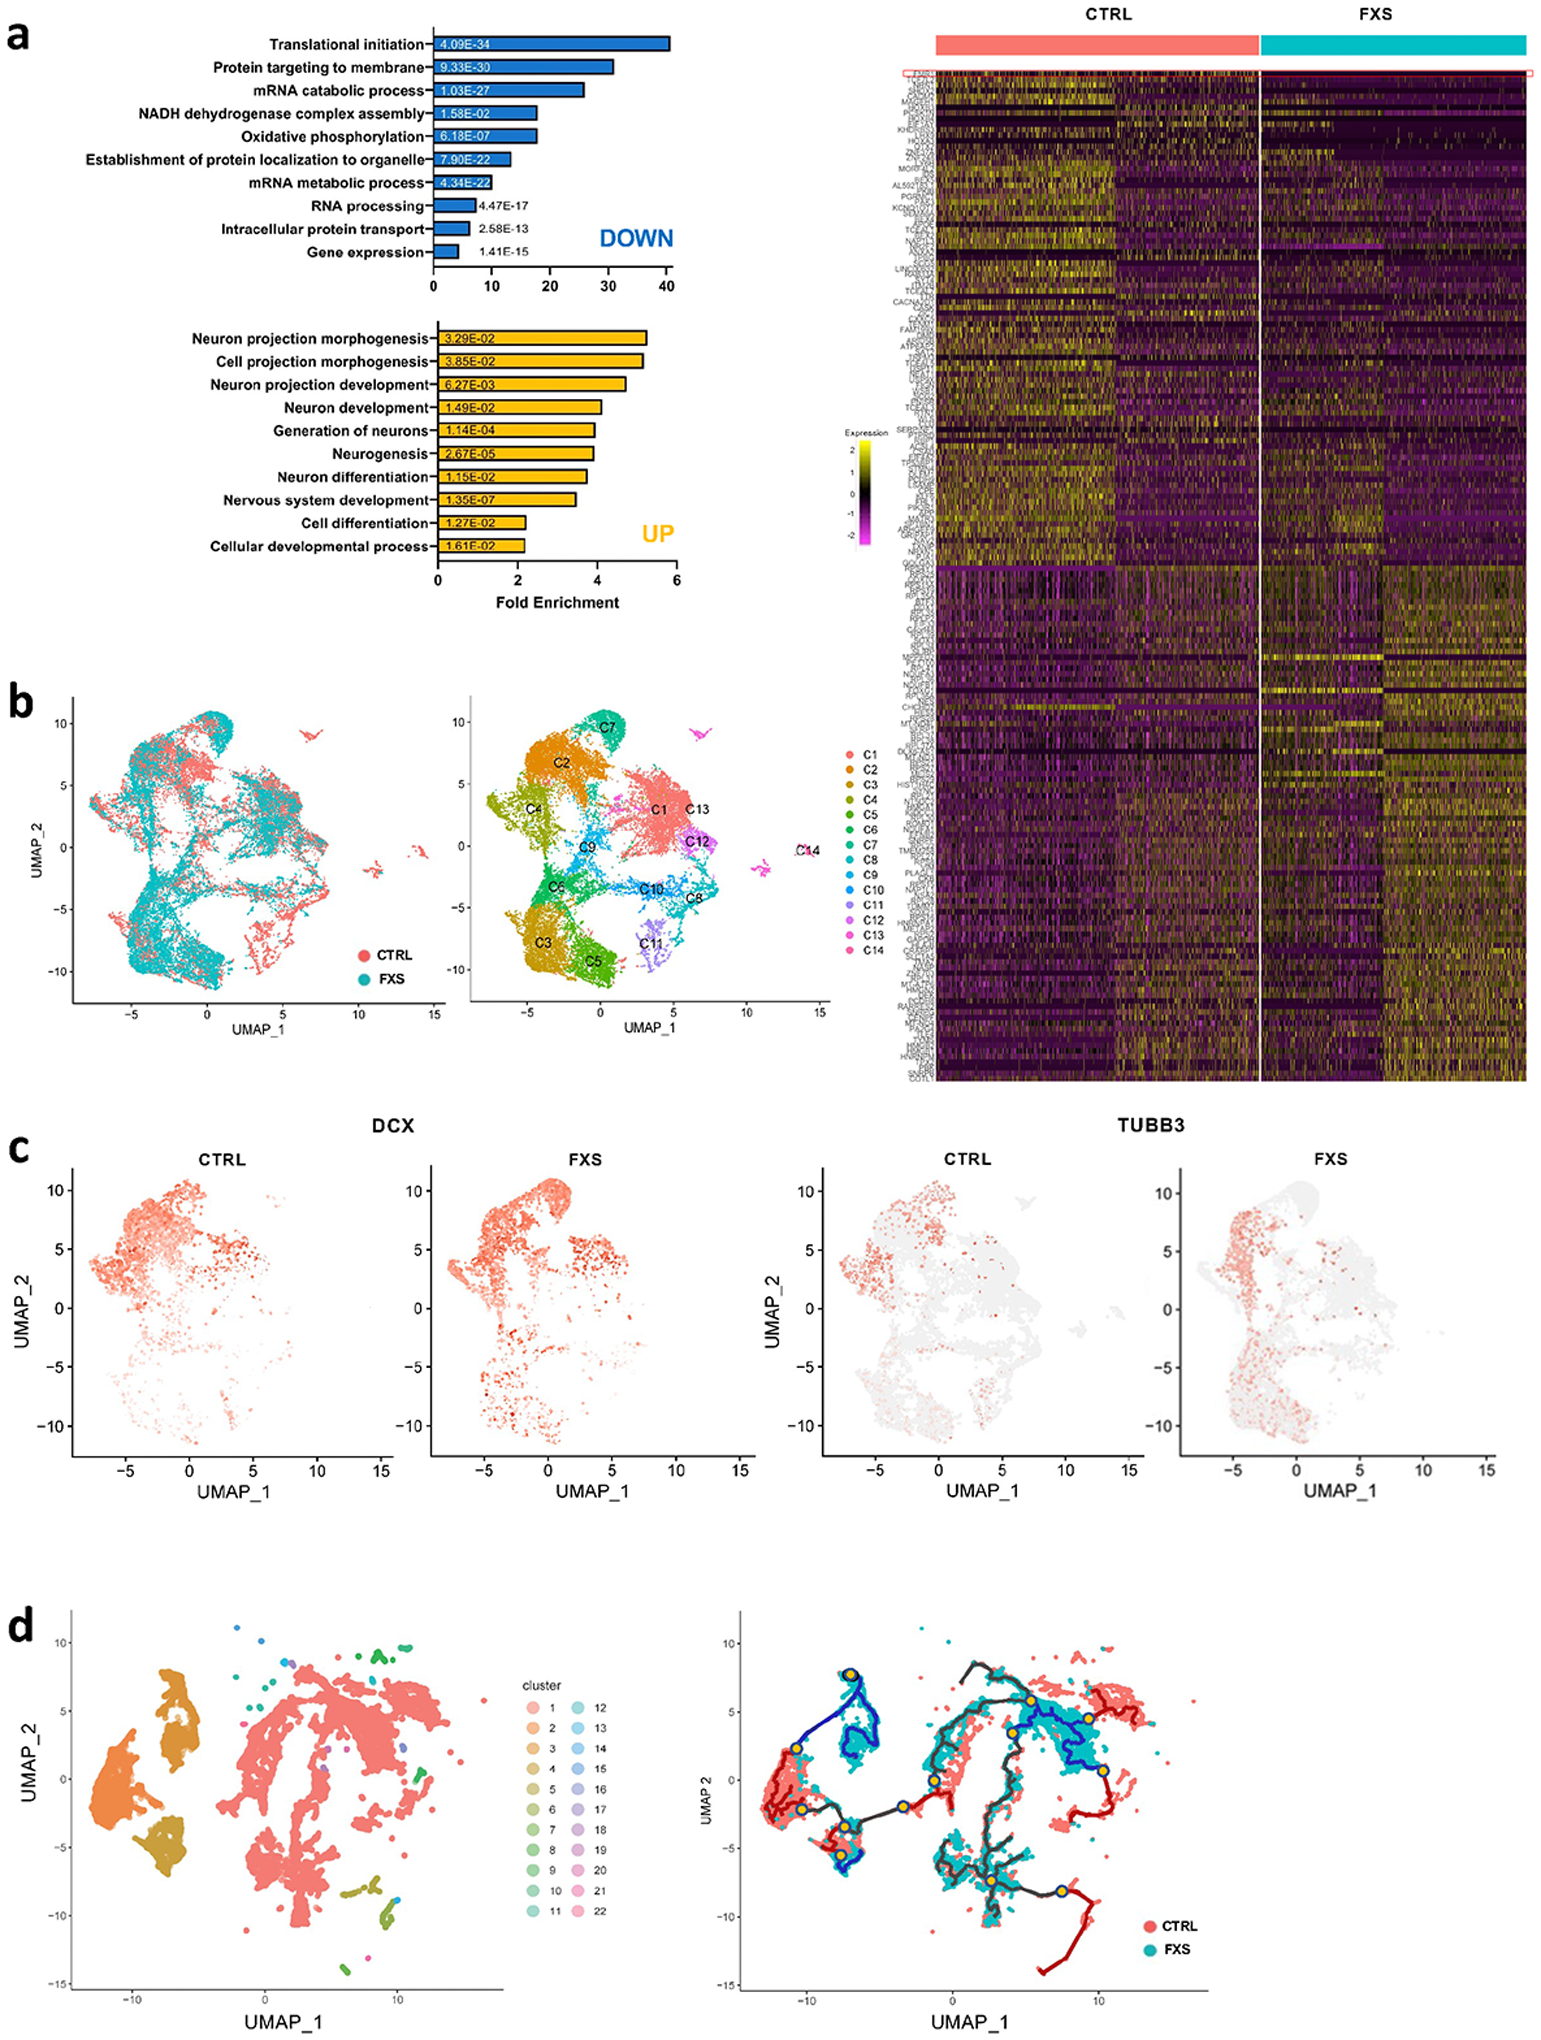
(a) Shown in the right panel is a heat map showing the normalized and scaled gene expression level in forebrain organoids at day 56 and bar plots of gene ontology analyses using PANTHER overrepresentation test on 100 upregulated genes (yellow bars) and 100 downregulated genes (blue bars) in left panel. FMR1 is shown on the top row. The numbers on the bars are two-sided p-values by Fisher’s exact test. P values have been adjusted for multiple testing by Bonferroni correction. (b) UMAP plots of control and FXS show the differential change in the population of specific cell types in FXS compared to control (left). Individual clusters were defined and annotated to distinct neural cell types (right). (c) UMAP plots of DCX, an immature neuron marker, and TUBB3, a mature neuron marker, reveal developmental progression alterations in FXS compared to control. (d) Twenty-two Monocle 3 clusters were identified and cluster-specific marker genes were determined (left). The overall pseudo-time trajectory of cells was obtained. The developmental trajectory indicated as a blue line for the FXS trajectory is quite distinct from the control organoid time trajectory in red (right). Branches are indicated in yellow dots. The progression direction is indicated by black arrowheads.