
Extended Data Fig. 1. FMRP regulates cortical neurogenesis in a human forebrain organoid model.
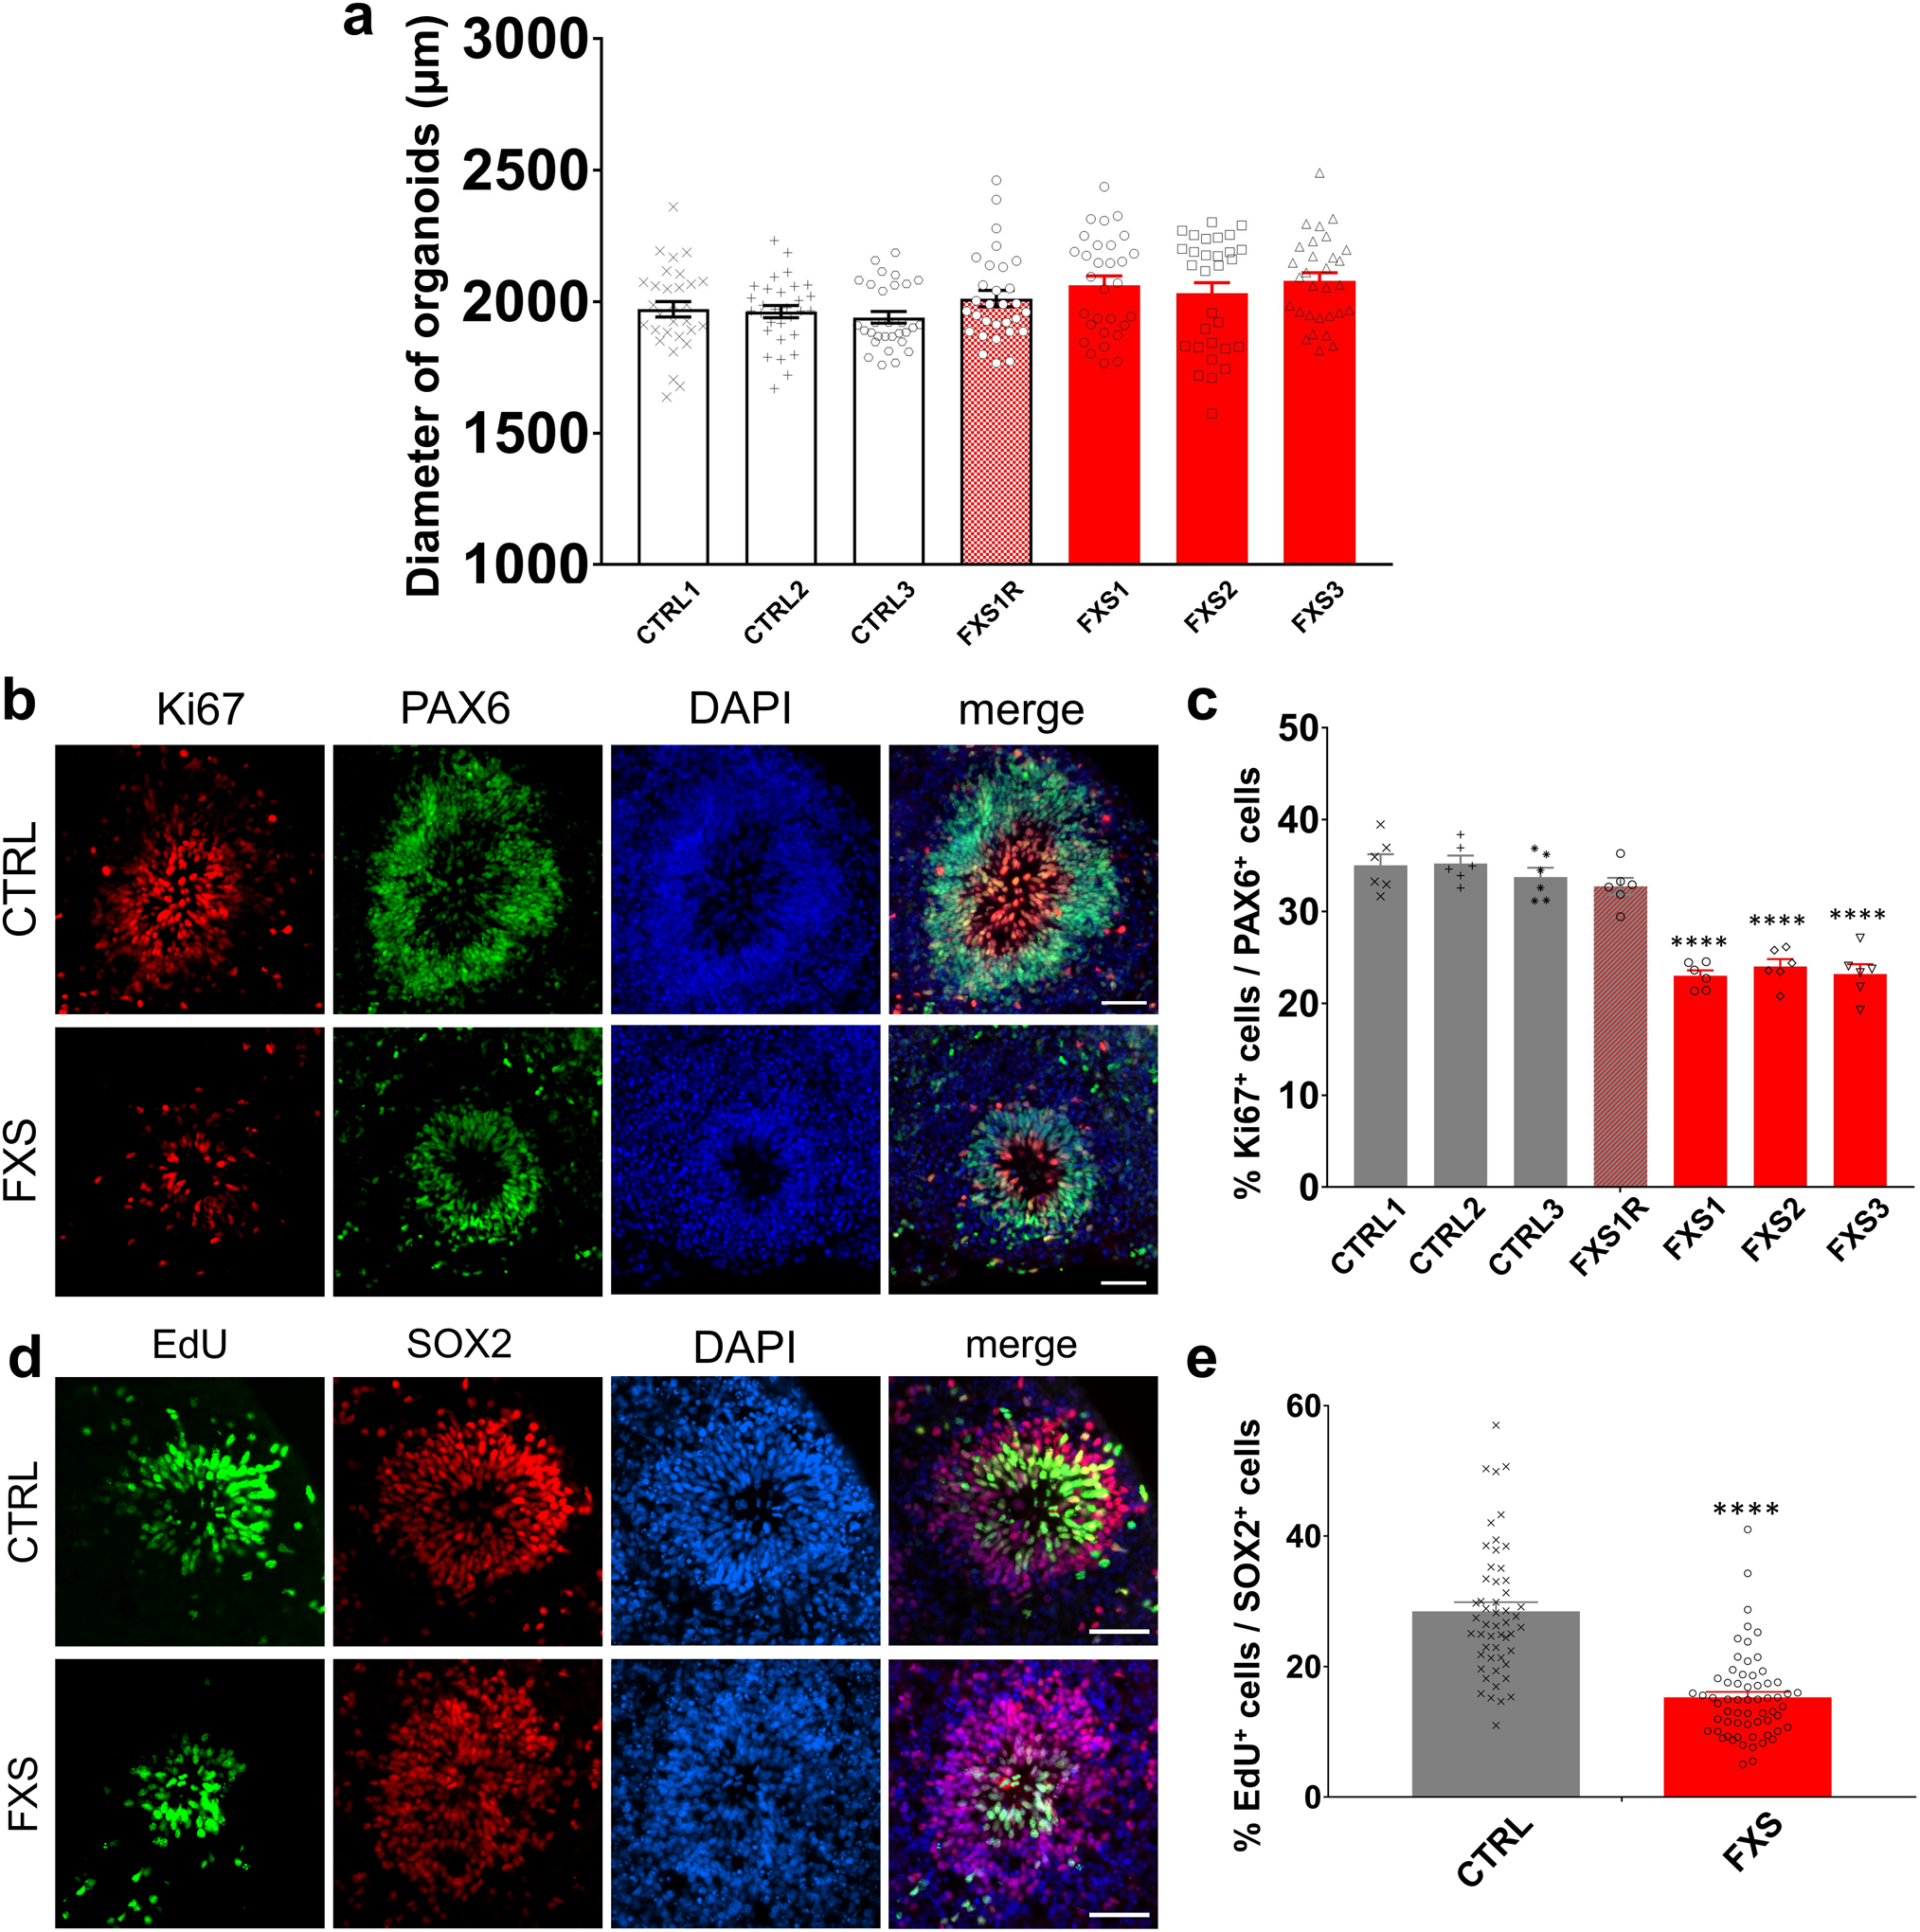
(a) Quantification of the size of control and FXS forebrain organoids. Data are presented as mean ± s.e.m. (n = 30 organoids from each line; one-way ANOVA). (b-c) Loss of FMRP reduces NPC proliferation. Shown are representative images (b) and quantification (c) of the proportion of Ki67+ proliferating neuronal progenitor cells in total PAX6+ dorsal forebrain neuronal progenitor cells of both control and FXS-derived forebrain organoids at day 56. Data are presented as mean ± s.e.m. (n = 6 organoids from each line with 15–20 cortical structures analyzed per organoid; ****P < 0.0001, one-way ANOVA). Scale bars: 50 μm. (d-e) D56 forebrain organoids were pulsed with EdU (10 μM) for 2 hr. Shown are representative images (d) and quantification (e) of the proportion of EdU+ proliferating cells in total SOX2+ NPCs in both control and FXS-derived forebrain organoids at day 56. Data are presented as mean ± s.e.m. (n = 62 cortical structures from at least ten organoids each condition; ****P < 0.0001, one-way ANOVA). Scale bars: 50 μm.