
Fig. 1.
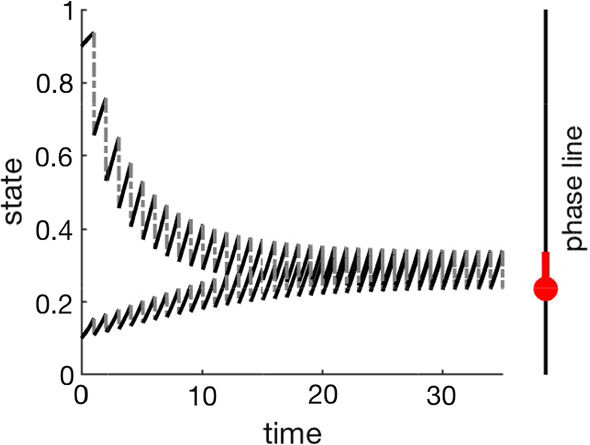
The plot shows two time series, with different initial conditions, for an impulsive differential equation. In this example, the state variable flows according to for a period of one time unit. The state variable then experiences an impulse (kick) proportional to its state at the end of the flow period, with . The two time series are converging to an asymptotically stable periodic solution of the impulsive system, which is shown in red on the phase line. The red dot denotes the fixed point of the associated flow-kick map (color figure online)