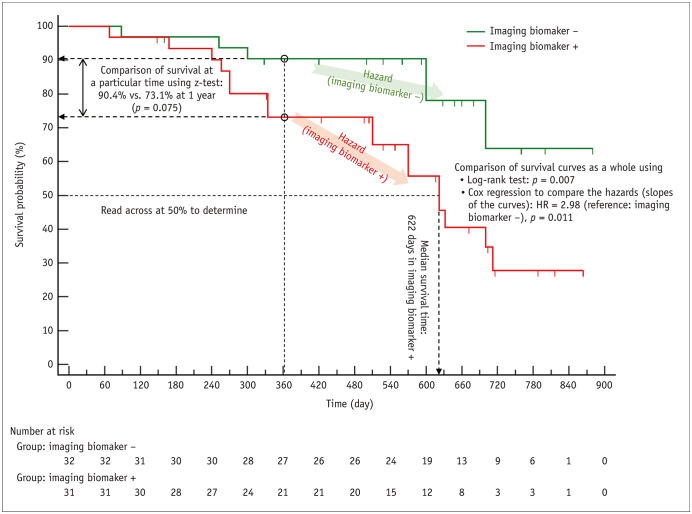
Fig. 1. Example Kaplan-Meier survival curves and a graphic summary of the related statistical parameters and statistical methods commonly used for survival analysis.
Two Kaplan-Meier survival curves, one each for patients with (red) and without (green) the imaging biomarker, are shown. The Kaplan-Meier method recalculates the survival probability every time a new patient develops an event, which decreases as shown by a downward step in the curve. Downward blips represent the censored patients. When a patient is censored, the survival curve does not dip down. The mean survival time in the sense of the mean length of time a subject can be expected to survive cannot be calculated until the last patient has developed an event. The median survival time can be obtained if the survival probability has dropped to 50%. Therefore, the median survival can be obtained for patients who are the imaging biomarker + (red); however, not for patients who are the imaging biomarker − (green). To determine the median survival time, draw a horizontal line at 50% survival, see where it crosses the curve, and look down at the x-axis to read off the time. The median survival time is 622 days for the group with the imaging biomarker (red). The survival of the two groups can be compared in several different ways. The log-rank test and the Cox proportional hazards regression are commonly used to compare the survival curves as a whole across the entire follow-up time. Patients without the imaging biomarker (green) shows significantly better survival according to both methods (p = 0.007 and p = 0.011, respectively). The Cox proportional hazards regression calculates HR. Hazard has the meaning of the slope of a survival curve, which is the rate of developing events in a time period, and the HR (i.e., the ratio of hazards of two survival curves) estimated by the Cox regression is essentially a relative risk. The HR of 2.98 indicates that the risk of death is 2.98 times greater in the patients with the imaging biomarker (red) compared to those without the imaging biomarker (green, the reference category). If one wants to compare the survival probability at a specific follow-up time, for example, at 1 year (90.4% vs. 73.1%), the z-test is commonly used (p = 0.075). HR = hazard ratio

