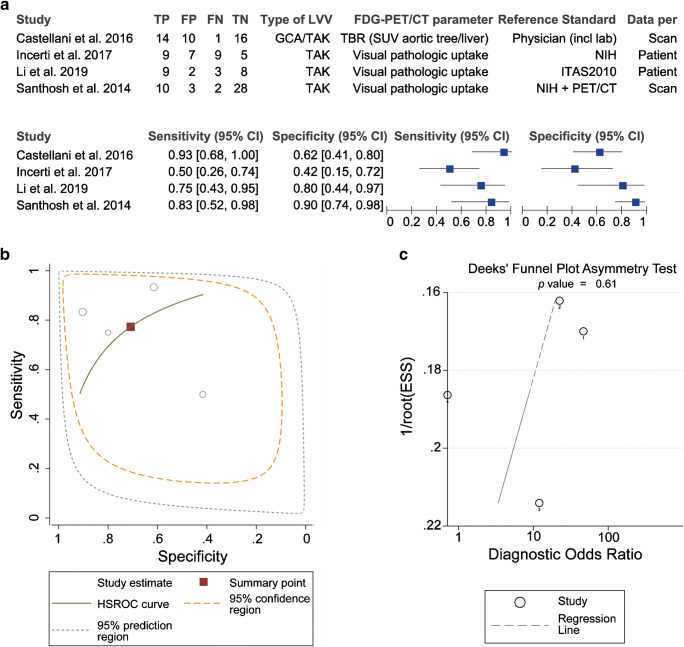
Fig. 5.
Heterogeneity and publication bias in meta-analysis of diagnostic accuracy of [18F]FDG-PET/CT during follow-up. Data were obtained from 4 cross-sectional studies in which at least 90% of patients were receiving treatment during the scan. a Forest plot and b HSROC plot of sensitivity and specificity. Pooled sensitivity was 77.3% (95%CI 56.5–89.9), and pooled specificity was 70.9% (95%CI 47.3–86.8). c Effective sample size (ESS) funnel plot and the associated regression test of asymmetry. A p value < 0.10 was considered evidence of asymmetry and potential publication bias

