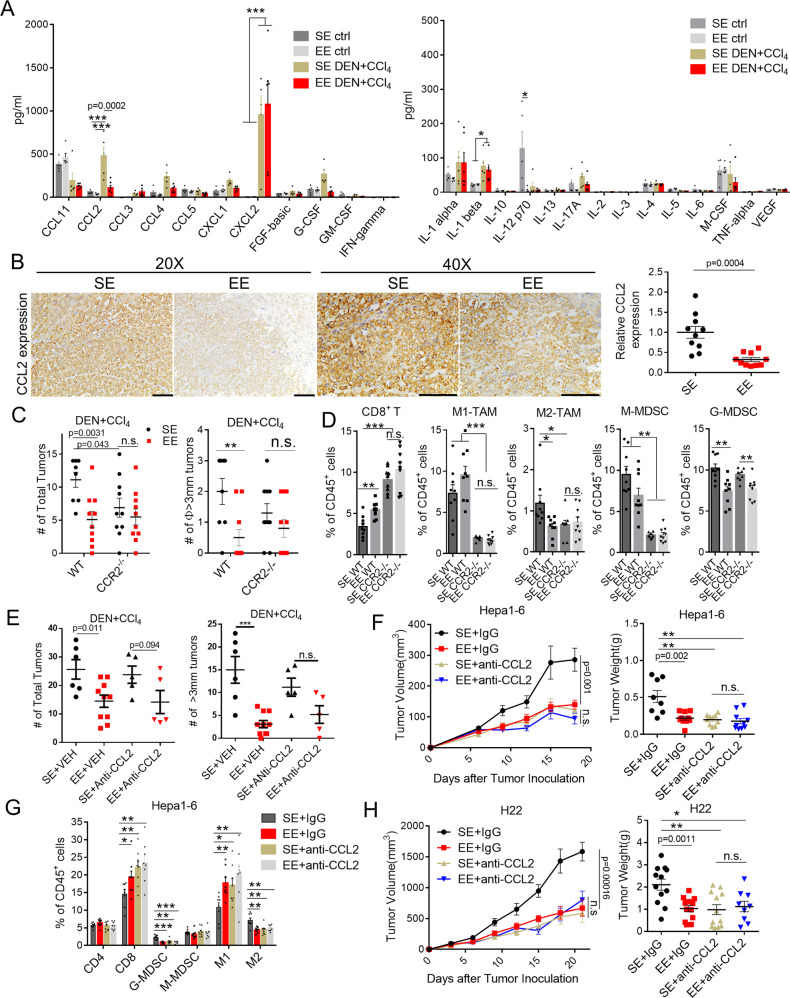
Fig. 3. CCL2/CCR2 signaling is required for the EE-induced antitumor immunity.
A Cytokine and chemokine profiles in serum detected from Normal or DEN/CCl4-induced HCC bearing mice (n = 5) under Standard Environment (SE) and Enriched Enrichment (EE) feeding conditions by use of Mouse Magnetic Luminex Screening Assay. All data are presented as the mean ± SEM, and analyzed by two-way ANOVA with *p < 0.05, **p < 0.01, ***p < 0.001. B Representative image of immunostaining of CCL2 on liver tumor tissues from DEN/CCl4-induced HCC model (left). The relative CCL2 expression in 20 × 10 magnification was quantified by Image J analysis (right, n = 10). Original magnification 20 × 10, Scale bar, 100 μm; Original magnification 40 × 10, Scale bar, 100 μm.Data are presented as the mean ± SEM, and analyzed by two-tailed unpaired Student’s t test. C Total tumor number (left) and diameter ø ≥ 3 mm tumor number (right) in Wild type (WT) or CCR2 knock out (CCR2−/−) mice injected with DEN + CCl4 and fed in SE or EE conditions (n = 8 for WT mice in SE group, n = 10 for other groups). All data are presented as the mean ± SEM, and analyzed by two-tailed unpaired Student’s t test. D Infiltrated immune cells within tumor microenvironment were analyzed by flow cytometry from tumors in DEN + CCL4 model (n = 8-9). All data are presented as the mean ± SEM, and analyzed by two-tailed unpaired Student’s t test with *p < 0.05, **p < 0.01, ***p < 0.001. E Total tumor number and diameter ø ≥ 3 mm tumor number in the liver of DEN + CCl4-treated mice with anti-CCL2 neutralization antibody (anti-CCL2) under SE or EE-feeding conditions (SE + VEH: n = 6, EE + VEH: n = 10, SE + anti-CCL2: n = 5, EE + anti-CCL2: n = 5). All data are presented as the mean ± SEM, and analyzed by two-tailed unpaired Student’s t test. F Tumor volume (left) and tumor weight (right) of subcutaneous Hepa1-6 tumors in C57BL/6 mice treated with anti-CCL2 neutralized antibody 18 days after tumor implantation (n = 8 for vehicle in SE group, n = 10 for other groups). All data are presented as the mean ± SEM, and analyzed by two-tailed unpaired Student’s t test with **p < 0.01. G Infiltrated immune cells in tumor microenvironment were analyzed by flow cytometry from Hepa1-6 tumors (n = 8 for each group). All data are presented as the mean ± SEM, and analyzed by two-tailed unpaired Student’s t test with *p < 0.05, **p < 0.01, ***p < 0.001. H Tumor volume (left) and tumor weight (right) of subcutaneous H22 tumors in C57BL/6 mice treated with anti-CCL2 neutralization antibody 21 days after tumor implantation (n = 9 for EE + anti-CCL2 group, n = 12 for other groups). All data are presented as the mean ± SEM, and analyzed by two-tailed unpaired Student’s t test with *p < 0.05, **p < 0.01.

