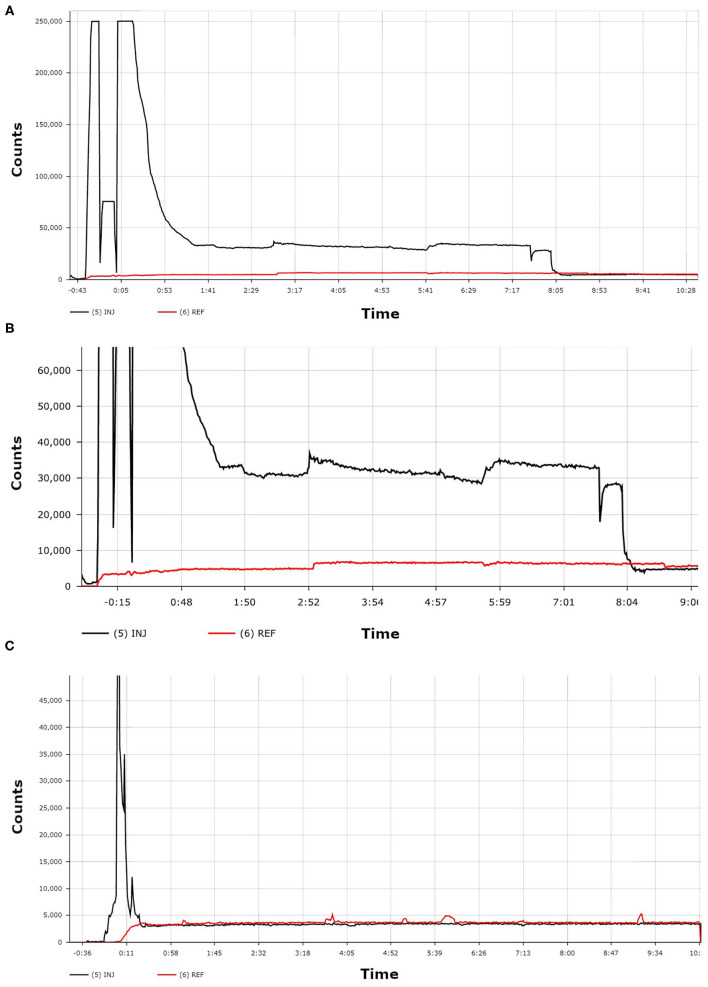
Figure 2.
The first TAC (A) shows the patient's administration with 99mTc-MDP. A zoomed-in view of this same TAC (B) more clearly shows the dramatic difference between the counts from the injection arm sensor curve (black line) and the counts from the reference arm sensor curve (red line). The third TAC (C) was acquired from a different patient and shows an ideal administration where the injection arm sensor curve (black line) and the reference arm sensor curve (red line) reached equilibrium within seconds.

