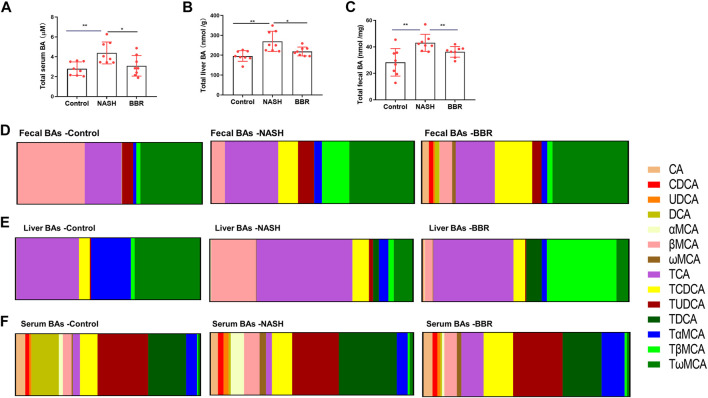
FIGURE 3.
BBR alters BA profiles in NASH mice. The total BA levels in the (A) liver, (B) serum and (C) feces. The ratio of BA species of (A) feces, (B) liver and (C) serum in control, NASH and BBR-treated mice. Data are presented as mean ± SEM (n = 8 per group). *p < 0.05, **p < 0.01 between groups.

