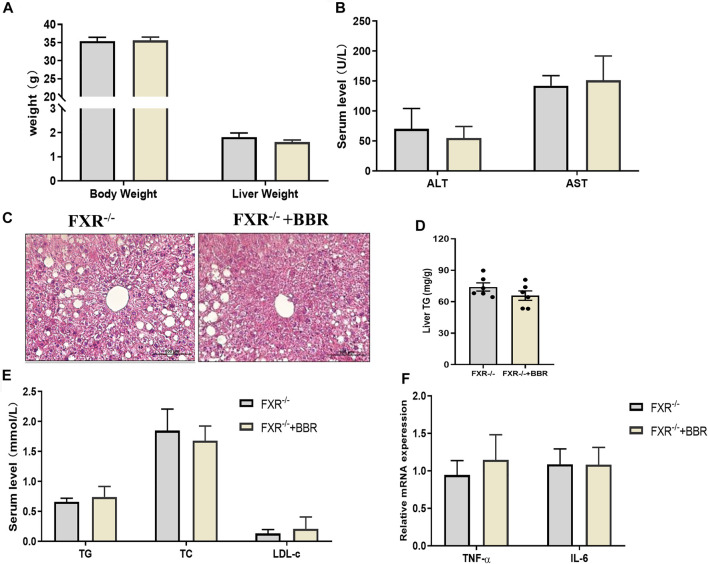
FIGURE 6.
The effect of BBR on FXR−/− mice. (A) The body weight and liver weight. (B) Serum ALT and AST levels. (C) Representative H&E staining images of liver sections (magnification 200×). (D) Liver TG content. (E) Serum TG, TC and LDL-c levels. (F) The mRNA expression of TNF-α and IL-6 in the liver. Data are presented as mean ± SEM (n = 6 per group).

