
Figure 7.
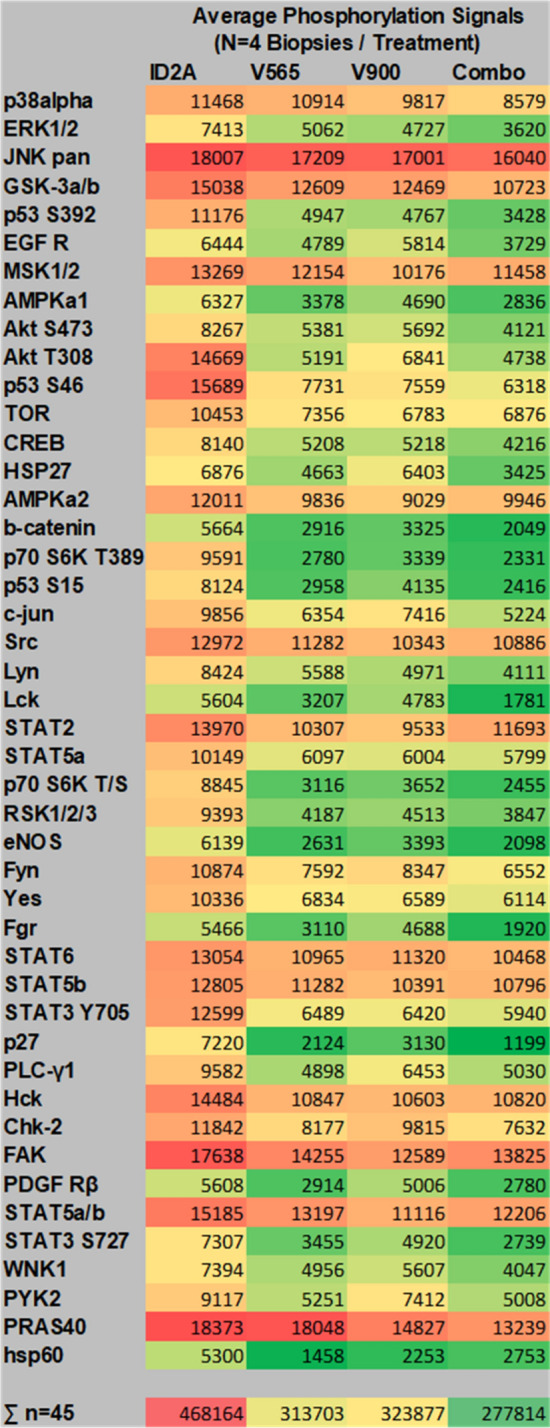
Phospho-array data from four UC patient biopsies grouped according to treatment. Biopsies from four different UC patients were incubated for 24 h with the different single domain antibody treatments (Control (ID-2A) 225 nM; anti-TNFα (V565) 75 nM; anti-IL-23 (V900) 150 nM or V565 75 nM + V900 150 nM combined). Lysates were analysed on R&D proteome profiler human phosphokinase arrays with chemiluminescent detection, image capture on film and quantitation of spot intensities using array analysis software. The array phospho-intensity data were averaged for each treatment (n = 4 biopsies). Values were processed using the conditional formatting option in Excel and colours were applied relative to the averaged signal of each phospho-protein in the final array data set. Red represents proteins with the strongest phosphorylation signals; Green represents proteins with the weakest phosphorylation. The inhibitory effects of the different antibody treatments are demonstrated by a shift from predominantly high levels of phosphorylation (red–orange) for biopsies treated with the isotype control ID2A, to relatively low (yellow to green) phospho-intensity values for biopsies treated with the anti-TNFα or anti-IL-23 antibodies or a combination of the two. For each treatment total phosphorylation values were calculated by summing the averaged (n = 4 biopsies) spot intensities of all 45 analytes.