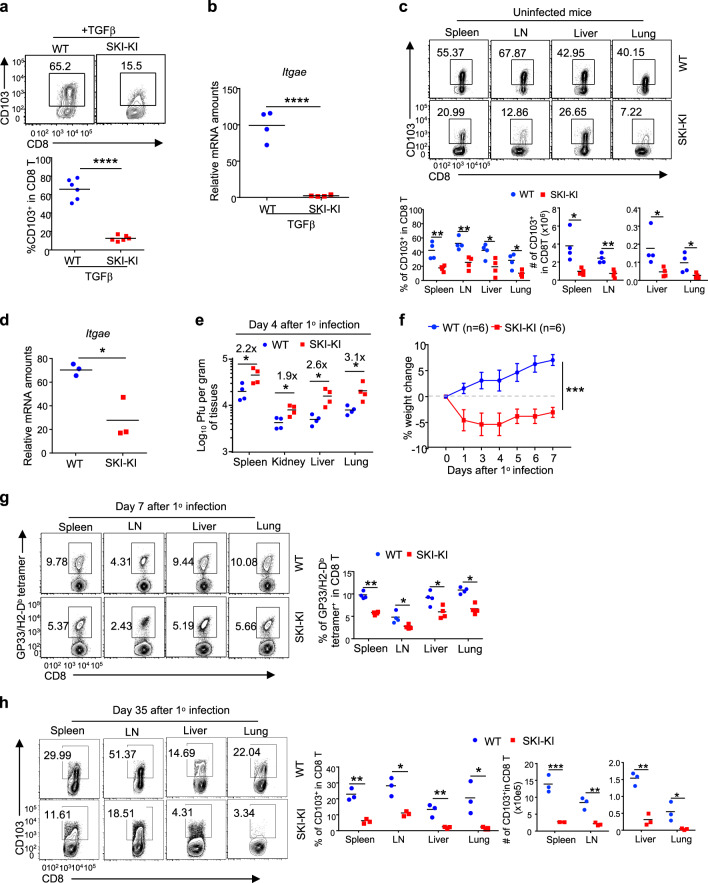
Fig. 4.
SKI suppresses CD103+CD8+ T cell generation and dampens antiviral responses. a Flow cytometry of CD103 expression on CD8+ T cells of the indicated genotypes after being activated in the presence of TGFβ for 2 days. (n = 5 samples from three experiments; representative results are shown; ***p < 0.001; per two-sided t-test; centers indicate the mean values). b qRT-PCR analysis of mRNA levels of Itgae gene-expressed CD8+ T cells of the indicated genotypes after being activated in the presence of TGFβ for 2 days. (n = 3 mice of three experiments; **p < 0.01 per two-sided t-test; centers indicate the mean values). c Flow cytometry of CD103 expression on CD8+ T cells from mice with the indicated genotypes to determine the percentages and numbers of CD103+CD8+ T cells in different tissues. (n = 4 mice of four experiments; representative results are shown; *p < 0.05, **p < 0.01 per two-sided t-test; centers indicate the mean values). d qRT-PCR analysis of mRNA levels of the Itgae gene expressed by splenic CD8+ T cells isolated from mice of the indicated genotypes. (n = 3 mice of three experiments; *p < 0.05 per two-sided t-test; centers indicate the mean values). e, f Mice with the indicated genotypes were infected once (1°) with LCMV-Armstrong. The viral titer in different tissues (e) and body weight changes (f) were assessed at the indicated time points. (n = 4 mice for (e) and n = 6 mice for (f) of two experiments; the mean ± s.e.m. for (f); *p < 0.05 per two-sided t-test for (e); ***p < 0.001 per two-way multiple-range ANOVA test for (f); centers indicate the mean values). g The percentages of LCMV-specific CD8+ T cells detected by GP33/H2-Db tetramer staining and flow cytometry in mice of the indicated genotypes 7 days after LCMV infection. (n = 4 mice of three experiments; *p < 0.05, **p < 0.01 per two-sided t-test; centers indicate the mean values). h The percentages and numbers of CD103+CD8+ T cells in different tissues from mice of the indicated genotypes 35 days post LCMV-Armstrong infection, assessed by flow cytometry. (n = 3 mice of three experiments; *p < 0.05, **p < 0.01, and ***p < 0.001 per two-sided t-test; centers indicate the mean values)

