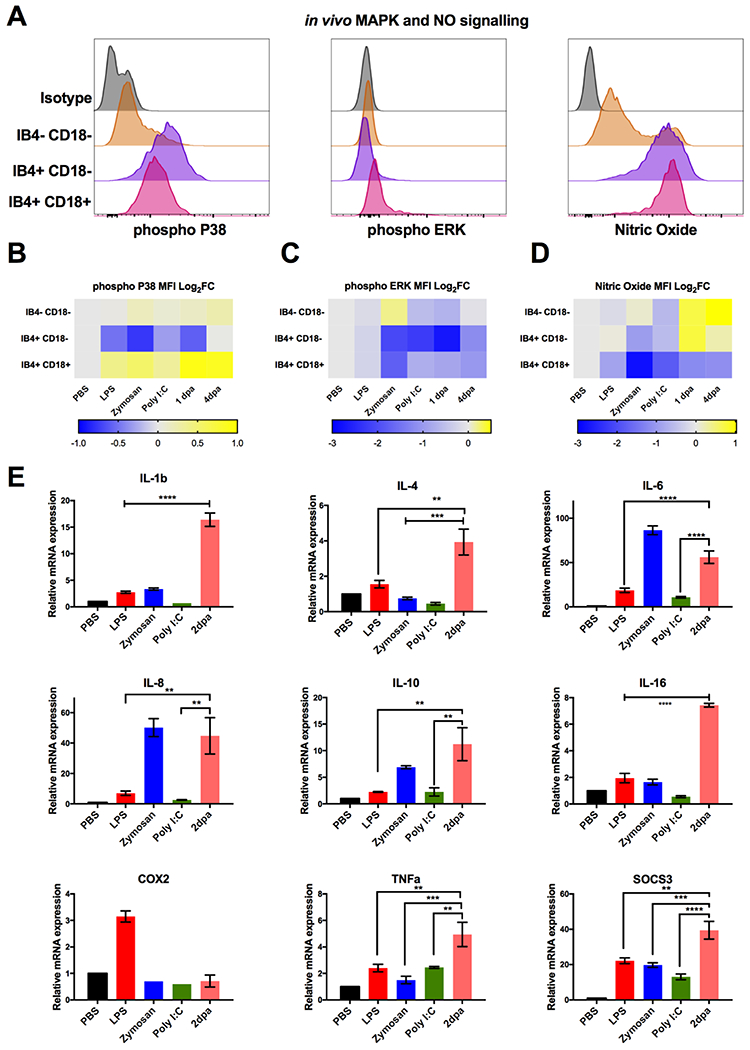
Figure 5. Regenerative tissues display unique inflammatory profiles compared with TLR stimulated tissues.

(A) Representative flow cytometry histograms depicting the expression of phospho-P38, phospho-ERK and nitric oxide in IB4+ CD18+, IB4+ CD18− and IB4− CD18− cells from limb tissue. (B-D) Heat map depicting log2 fold changes of the average median fluorescence intensity of IB4+ CD18+, IB4+ CD18− and IB4− CD18− cells during limb regeneration and in vivo TLR stimulation for (B) phospho-P38, (C) phospho-ERK and (D) nitric oxide. n=8. Warmer colours indicate an increase in fold change whilst cooler colours indicate a decrease. (E) Comparison of inflammatory gene mRNA expression measured by quantitative RT-PCR. Bar charts represent mean ± SEM of 4 biological samples. p-values obtained via unpaired Student’s t-test., **P ≤ 0.01, ***P ≤ 0.001 and ****P ≤ 0.0001.
