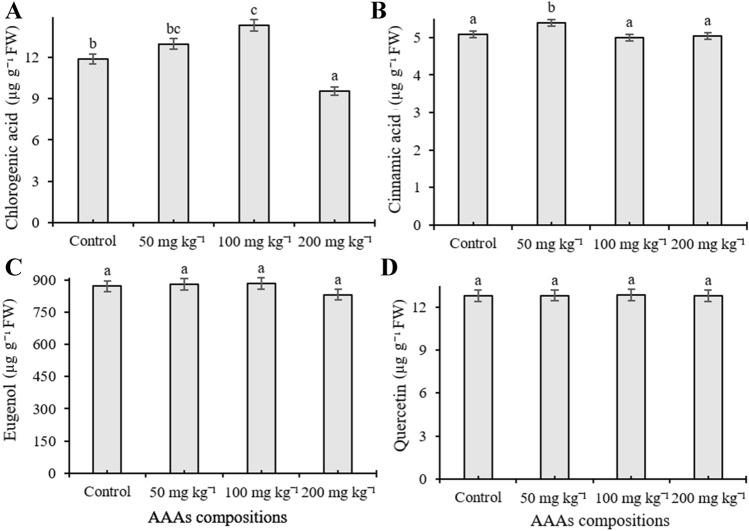
Fig. 5.
The content of chlorogenic acid (A), cinnamic acid (B), eugenol (C) and quercetin (D) of the leaves of O. basilicum exposed to 0, 50, 100, 200 mg kg−1 AAAs treatment. Mean values with the different letters indicate significant differences at p ≤ 0.05 (Duncan test). Data expressed is as µg g−1 FW

