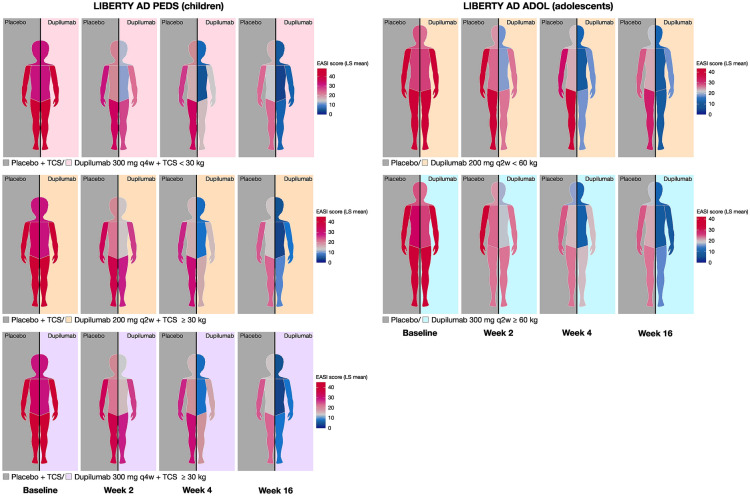
Fig. 1.
Analysis of value in EASI regional scoresa (from baseline to week 16)b. aEASI regional scores nonweighted for % BSA. bFor graphical purposes, figures have been constructed to represent the right side of the body being treated with placebo and the left side being treated with dupilumab. In patients receiving dupilumab, similar responses were achieved on both sides of the body. BSA body surface area, EASI Eczema Area and Severity Index, LS least squares, q2w every 2 weeks, q4w every 4 weeks, TCS topical corticosteroid

