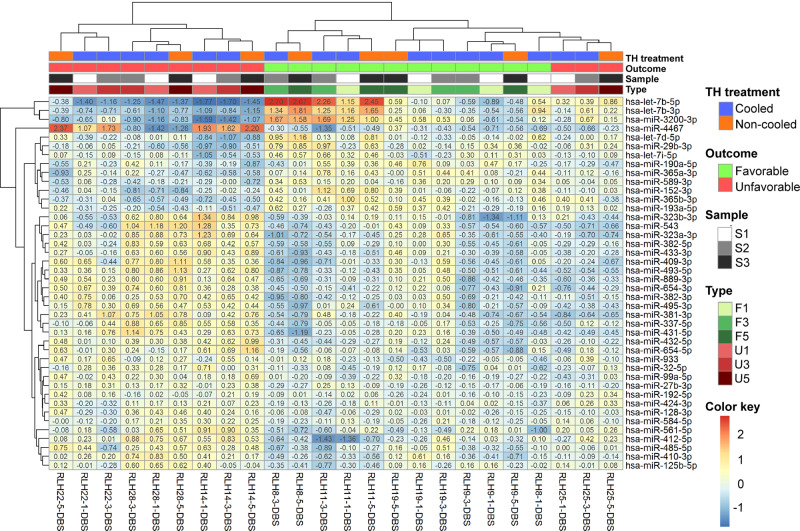
Fig. 2. Hierarchical clustering analysis of all the differentially expressed miRNAs by outcome.
Hierarchical clustering analysis using the R program showing let-7b in the forms of 3p and 5p strands to be the most significantly changed miRNA in the moderate to severe NE neonates with TH treatment based on outcome. F1, F3 and F5 represent favourable outcome on days 1, 3 and 5 respectively; while U1, U3 and U5 represent unfavourable outcome on days 1, 3 and 5 respectively.

