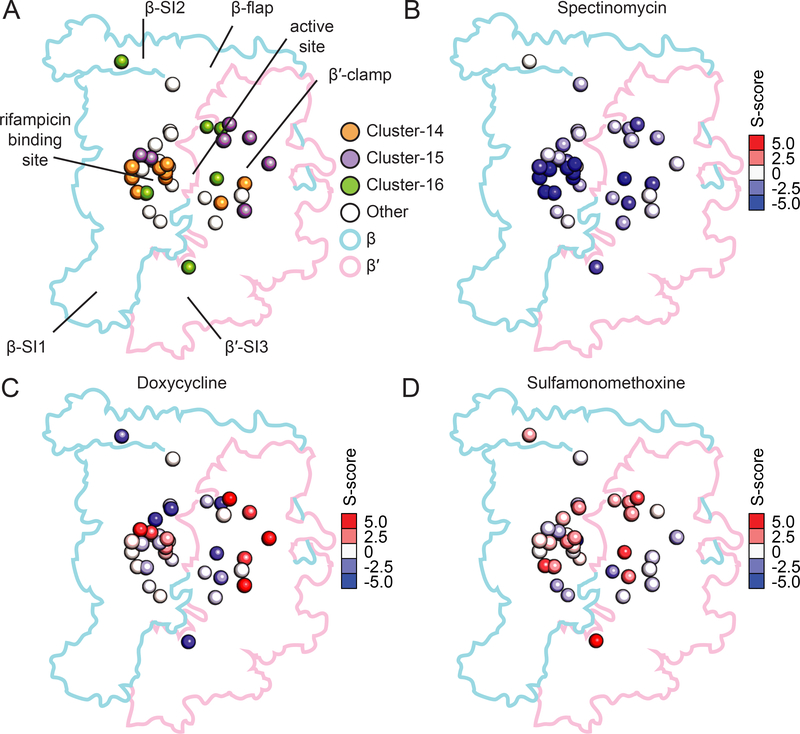
Figure 3: Mutations in core RNAP can be separated into clusters based on chemical sensitivities.
A) Three major clusters of point mutations within the core complex of β and β′ were identified. Cluster 14 (orange) is centered around the rifampicin binding site, cluster 15 (purple) is found mostly in the β′-clamp, and cluster 16 (green) is distributed throughout the complex, including β′-SI3, the active site, and β-SI2. Point mutations in RNAP not included in clusters 14–16 are shown in white. The alpha carbon of mutated residues is shown as a sphere in the structure.
B) Representation of S-scores indicating the extent of sensitivity to spectinomycin (enriched in Cluster 14). The alpha carbons of mutated residues are shown as spheres colored by the magnitude and direction of the mutant’s S-score in the dataset. Red indicates resistance and blue indicates sensitivity.
C) Representation of S-scores indicating the extent of resistance to doxycycline (enriched in Cluster 15) and sensitivity to doxycycline (enriched in Cluster 16). Mutations are presented in the structure as in (B).
D) Representation of S-scores indicating the extent of resistance to sulfamonomethoxine (enriched in Cluster 16). Mutations are presented as in (B).

