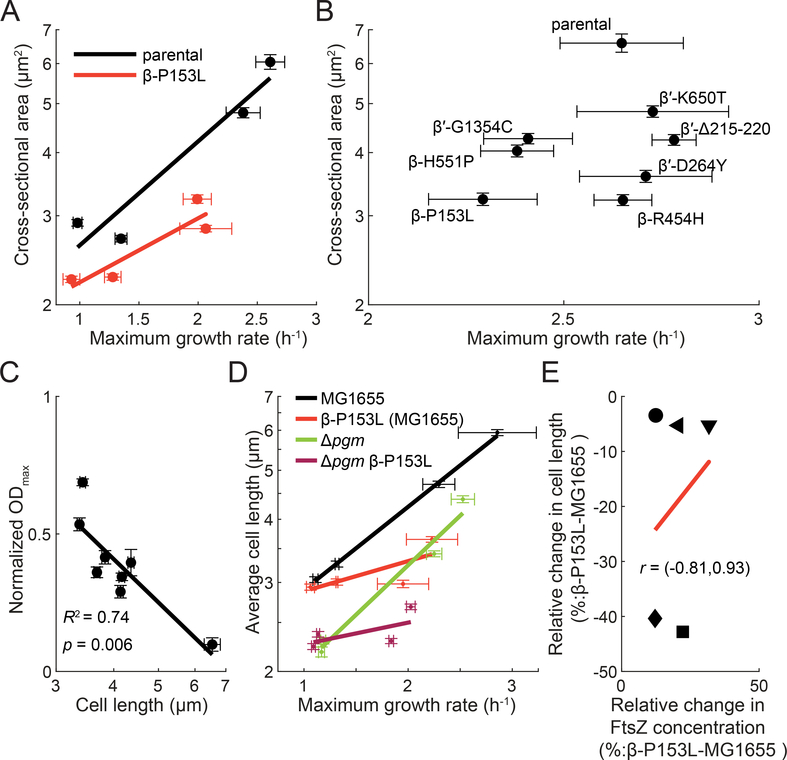
Figure 7: Decreased cell length in M+ mutants is associated with A22 resistance.
A) β-P153L cells are smaller than the parental control, even after controlling for growth rate. β-P153L (red) and its parental control (black) were grown for multiple generations in log phase in four media: MOPS minimal medium+0.2% glucose, MOPS minimal+0.2% glucose supplemented with 12 amino acids (see Methods), MOPS complete medium+0.2% glucose, and Tryptic Soy Broth. Maximum growth rate was extracted from growth curves started with log-phase cultures. Phase-contrast images of log-phase cells grown at steady state were acquired after spotting the cultures on PBS+1% (w/v) agarose pads, and cell area was computed from the segmented single-cell contours. Straight lines are linear regressions. Error bars on both axes are 95% confidence intervals for individual measurements.
B) M+ mutant cells are smaller than the parental control. Seven M+ mutants from different clusters were grown into log phase in lysogeny broth (LB) along with their parental control. Cultures were simultaneously spotted onto PBS+1% (w/v) agarose pads to measure cell size and used to inoculate growth curves to measure maximum growth rate. All M+ mutants were significantly smaller than their parental control, while only β-P153L, β-H551P, and β′-G1354C exhibited a statistically significant decrease in maximum growth rate.
C) A22 resistance is correlated with cell length. Maximum OD600 of the 7 M+ mutants and their parental control in LB with 13.5 μg/mL A22 was extracted from growth curves and normalized by growth curves in LB without antibiotic. Normalized ODmax values were strongly correlated with cell length from measurements in (B) (R2=0.74, p=0.006).
D) Δpgm is not epistatic to β-P153L. MG1655 (black), β-P153L (red), Δpgm (green), and β-P153L Δpgm (magenta) were grown for multiple generations in log phase in four media: M9 minimal medium with 0.2% (w/v) glucose, M9 minimal medium with 0.2% (w/v) glucose and supplemented with 12 amino acids (see Methods), LB, and LB with 0.2% (w/v) glucose. Growth curves were started in a plate reader with log-phase cultures. Phase-contrast images of log-phase cells grown in steady were acquired after spotting the cultures on LB + 1% (w/v) agarose pads, and cell length was calculated from the mesh computed for segmented single-cell contours. Straight lines are linear regressions. Error bars on both axes are 95% confidence intervals for individual measurements. If the length phenotype of Δpgm was epistatic to that of β-P153L, then the double mutant would have resembled Δpgm. Instead, Δpgm β-P153L exhibited a combination of the length phenotypes of both single mutants.
E) The relative change in FtsZ protein concentration is not correlated with decreases in average cell length in β-P153L as compared to MG1655. MG1655 FtsZ-msfGFP and MG1655 β-P153L FtsZ-msfGFP were grown in log phase for multiple generations in 5 media: M9 minimal medium with 0.2% (w/v) glycerol (circles), M9 minimal medium with 0.2% (w/v) glucose (leftwards-pointing triangles), M9 minimal medium with 0.2% (w/v) glucose and supplemented with 12 amino acids (downwards-pointing triangles), LB (squares), and LB with 0.2% (w/v) glucose (diamonds). Phase-contrast and fluorescence images of single cells were acquired after spotting log-phase cultures on PBS agarose pads with 1% (w/v) agarose. FtsZ-msGFP concentration was calculated from single-cell contours segmented from phase-contrast images by integrating the background-subtracted fluorescence within the contour area and normalizing by calculated cell volume. Relative cell length decreases the most in β-P153L in rich media like LB and LB 0.2% glucose, but this does not correspond to a proportional increase in FtsZ concentration. A linear fit to the data is shown as a red line. The correlation between the relative changes in FtsZ concentration and cell length is largely indeterminate as shown by the 95% confidence interval (Pearson’s r=0.25, 95% confidence interval: −0.81–0.93)

