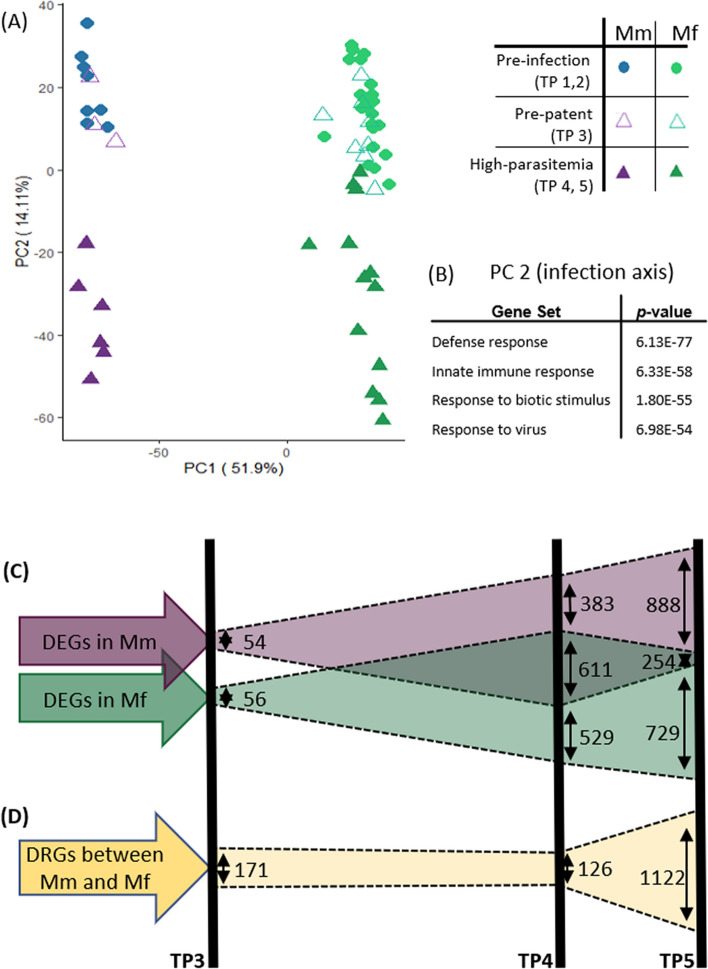
Figure 2.
Transcriptomics patterns of whole-blood gene expression of all samples at time points TP1–TP5 from Mm and Mf. (A) Principal component analysis (PCA) of all samples from Mm and Mf. PC1 captures inter-species variance in expression profiles, while PC2 captures temporal variance in expression profiles. Pre-infection samples TP1 and TP2 (before infection) form species-specific clusters that are separate from the samples at TP4 and TP5, reflecting peaking parasitemia. TP3 (3 days after inoculation of sporozoites, and prior to blood-stage parasitemia, i.e., the pre-patent period) samples cluster with the pre-infection samples TP1 and TP2. (B) Top GO gene sets over-represented in PC2. (C) Differentially expressed genes (DEGs) and (D) Differentially responding genes (DRGs) in TP3-TP5. The numbers of DEGs change significantly between TP3 (~ 50) and TP4 (~ 1000–1140) for both Mm (purple) and Mf (green), and then remain similar between TP4 and TP5 (~ 1000–1100) for each species. However, the number of common DEGs between Mm and Mf decreases substantially from TP4 (611) to TP5 (254). Concomitantly, the DRGs between TP4 and TP5 (gold) increase substantially.

