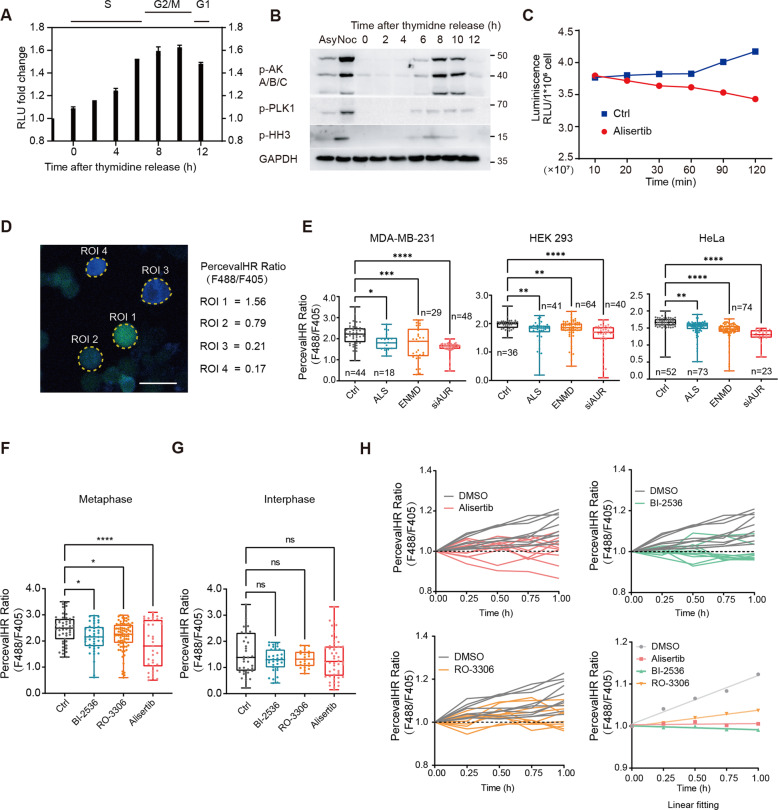
Fig. 2. Mitotic kinase inhibition disrupts cellular energy homeostasis during mitosis.
A ATP bioluminescent assay measuring relative ATP levels in cells released at indicated time points from a double-thymidine block. Asynchronized cells were used as controls. Mean ± SD; n = 3. B Analysis of the cell-cycle progression in MDA-MB-231 cells released from a double-thymidine block using p-HH3 (Phospho Histone H3 (S10)), p-AKA/B/C (Phospho-Aurora A (Thr288)/Aurora B (Thr232)/Aurora C (Thr198)), and p-PLK1 (Phospho-PLK1 (Thr210)). Asynchronized and nocodazole-synchronized mitotic cells were used as controls. C The relative ATP levels of mitotic cells were measured at the indicated time points after 100 nM alisertib treatment. Intracellular ATP levels were detected by ATP bioluminescent assay; n = 3. D Representative images of PercevalHR-expressing MDA-MB-231 cells synchronized in mitosis by nocodazole. The sensor bound to ATP (green), ADP (blue), or PercevalHR ratiometric signal is demonstrated. Scale bar, 25 µm. E PercevalHR ratio in mitotic cell cells after 2 h treatment with vehicle control (Ctrl), 100 nM alisertib (ALS), 5 μM ENMD-2076 (ENMD), or siRNA targeting Aurora-A (siAUR). *p < 0.05; **p < 0.01; ***p < 0.001; ****p < 0.0001. By one-way ANOVA. F Quantification of pH-corrected PercevalHR ratiometric signal in single cells synchronized at mitosis. All samples were treated for 2 h with vehicle control (Ctrl), 100 nM BI-2536, 10 μM RO-3306, or 100 nM alisertib in a complete growth medium before imaging. ns not significant; *p < 0.05; ***p < 0.001; ****p < 0.0001. By one-way ANOVA. Mean ± SD, (n = 50: Ctrl; n = 43: B; n = 80: R; n = 35: A). G Quantification of pH-corrected PercevalHR ratiometric signal in interphase cells. All samples were treated as in Fig. 2F and analyzed by one-way ANOVA. ns not significant. Mean ± SD, (n = 35: Ctrl; n = 32: B; n = 22: R; n = 48: A). H Live imaging of PercevalHR expressing cells synchronized at mitosis. Quantification of intracellular F488/F405 (ATP/ADP) ratios in single cells incubated in DMEM with vehicle control (DMSO), BI-2536, RO-3306, or alisertib. (Lower right) Linear fitting of F488/F405 (ATP/ADP) ratios at different time points. (The experiment was conducted on the same panel, the same DMSO group is shown in each image; The first recorded ratio was normalized to 1); n = 10.

