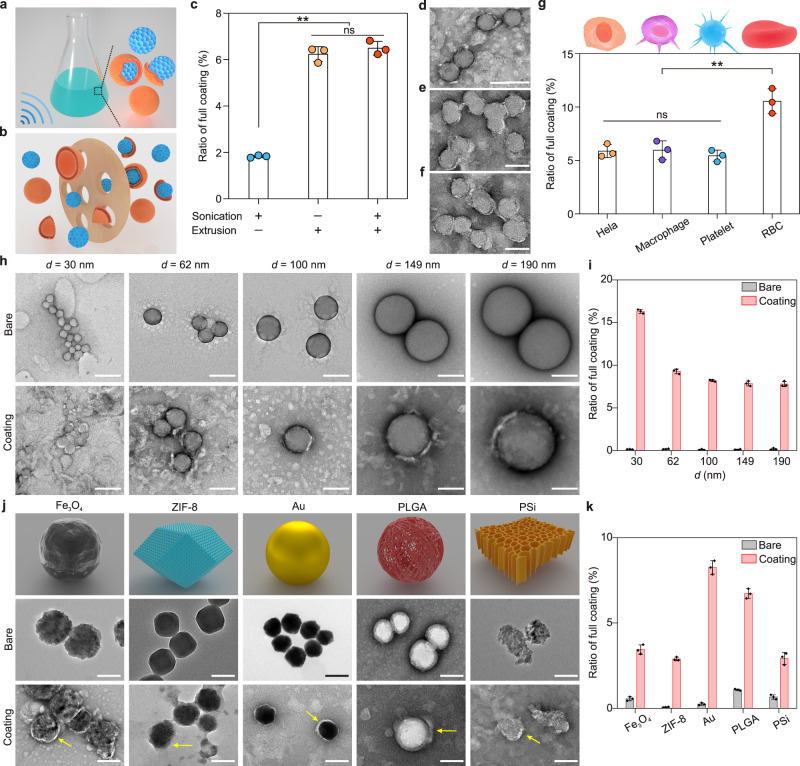
Fig. 2. Validation of partial cell membrane coating under different experimental designs.
a, b Schematic illustration of the preparation of cell membrane-coated NPs with a sonication method (a) and a physical co-extrusion method (b). c Quantification of the ratio of full cell membrane coating with different coating methods (sonication, extrusion, and combined sonication-extrusion). d−f TEM images of CM-SiO2 NPs fabricated using sonication (d), extrusion (e), and combined sonication-extrusion (f). Scale bars, 100 nm. g Quantification of the ratio of full cell membrane coating for SiO2 NPs coated with different source cell membrane materials (HeLa, macrophage, platelet, and RBC). h TEM images of different sizes of nonporous Stöber SiO2 NPs before and after coating with cell membranes. Scale bars, 100 nm. i Quantification of the ratio of full cell membrane coating for cell membrane-coated nonporous Stöber SiO2 NPs of different sizes. j TEM images of Fe3O4 NPs, ZIF-8 NPs, Au NPs, PLGA NPs, and porous silicon (PSi) NPs before and after coating with cell membranes. Scale bars, 100 nm. k Quantification of the ratio of full cell membrane coating for different core materials (Fe3O4 NPs, ZIF-8 NPs, Au NPs, PLGA NPs, and PSi NPs). Data represents mean ± SD (n = 3). One-way ANOVA followed by post hoc Tukey test was used to determine the significance in c and g. p = 1.7E-6 (c: sonication+ and extrusion– vs. sonication– and extrusion+), p = 1.2E-6 (c: sonication+ and extrusion– vs. sonication+ and extrusion+), p = 6.1E-4 (g: RBC vs. Hela), p = 7.0E-4 (g: RBC vs. macrophage), p = 3.3E-4 (g: RBC vs. platelet). **p < 0.01. ns: not significant.

