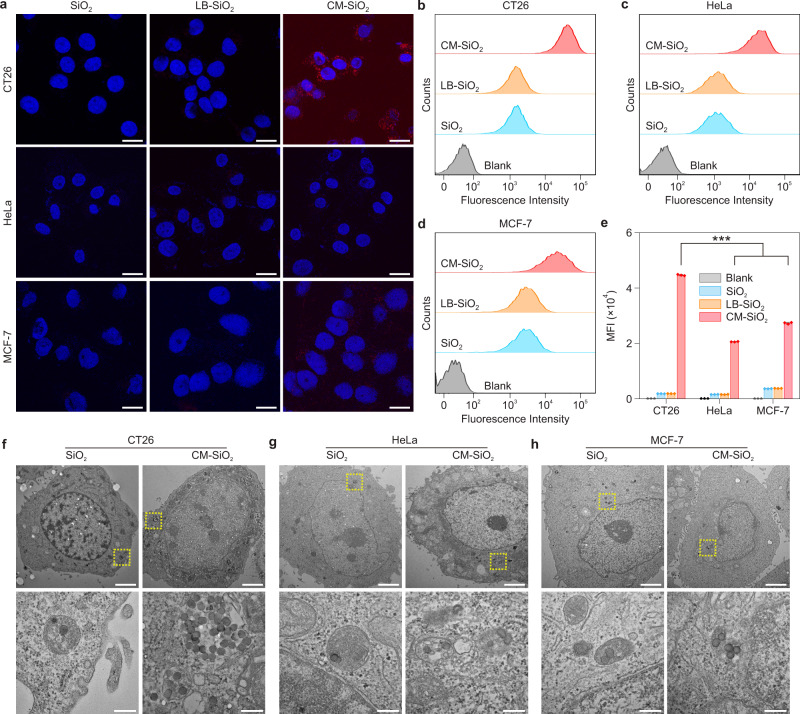
Fig. 3. In vitro characterization of the homologous targeting capabilities of CM-SiO2 NPs.
a Representative CLSM images of three cell lines (CT26, HeLa and MCF-7) after 4 h incubation with SiO2 NPs, LB-SiO2 NPs and CM-SiO2 NPs. The SiO2 cores were labeled with Cy5 (red), and the cell nuclei were stained with 4’,6-diamidino-2-phenylindole (DAPI; blue). Scale bars, 20 μm. b–d Flow cytometric analysis of CT26 cells (b), HeLa cells (c) and MCF-7 cells (d) incubated with blank solution, SiO2 NPs, LB-SiO2 NPs and CM-SiO2 NPs. e Quantification of the mean fluorescence intensities for the three cell lines (CT26, HeLa, and MCF-7). Data represents mean ± SD (n = 3). One-way ANOVA followed by post hoc Tukey test was used to determine the significance of data. ***p < 0.001. f–h TEM images of CT26 cells (f), HeLa cells (g), and MCF-7 cells (h) after 4 h incubation with SiO2 NPs and CM-SiO2 NPs. Insets below are magnified of each image in the area highlighted with the respective yellow dashed box. Scale bars, 2 μm (top); 200 nm (bottom).

