Fig. 3.
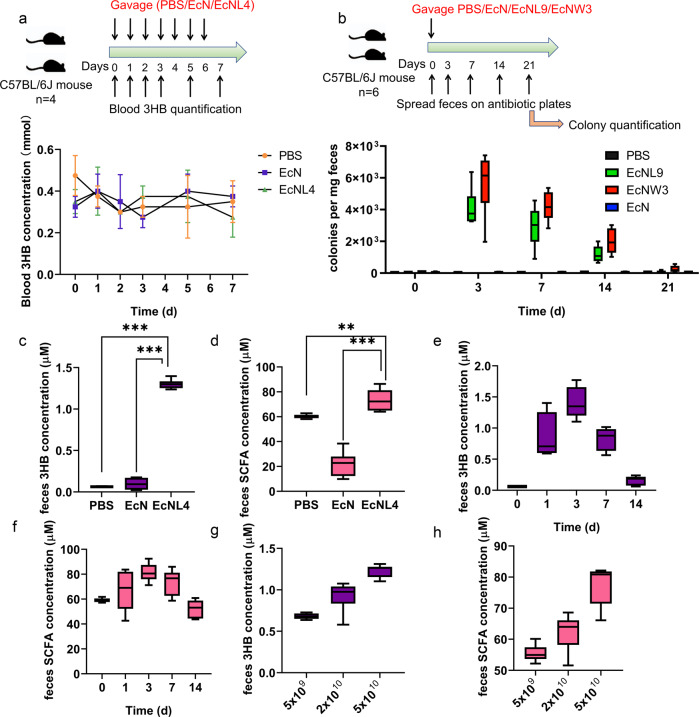
In vivo pharmacokinetics of recombinant EcNL4 in mice. a Blood 3HB dynamics after oral administration of the EcNL4 strain. Cells were administered at 5 × 10¹⁰ per mouse. The mouse type, numbers, gavage, and quantification frequencies are indicated in the figure. b Engineered EcN gut colonization dynamics after cell administration. EcNL9 was an EcNL4 strain with an ampicillin resistance gene. The EcNW3 strain was EcNW2 with an ampicillin resistance gene. Cells were administered at 5 × 10¹⁰ per mouse. The mouse type, numbers, gavage, and detection frequencies are indicated in the figure. c Fecal 3HB concentrations after administration. Feces were sampled on the 3rd day after gavaging. d Fecal SCFA contents after the administration. Feces were sampled on the 3rd day after gavaging. SCFA titers were calculated by accumulating formate, acetate, propionate, butyrate and valerate concentrations. e The 3HB dynamics 14 days after EcNL4 administration. f The SCFA dynamics 14 days after EcNL4 administration. The SCFA titers were calculated by accumulating formate, acetate, propionate, butyrate and valerate concentrations. g The effects of cell amount on 3HB production. Feces were sampled on the 3rd day after gavaging. h The effects of cell amount on SCFA production. Feces were sampled on the 3rd day after gavaging. The SCFA titers were calculated by accumulating formate, acetate, propionate, butyrate and valerate concentrations. All data represent the mean value of 6 biologically independent samples except in a. Data in a were from 4 biologically independent samples. Error bars indicated standard deviations. Two-tailed Student’s t tests were conducted to suggest statistical significance for comparisons. **p < 0.01. ***p < 0.001

