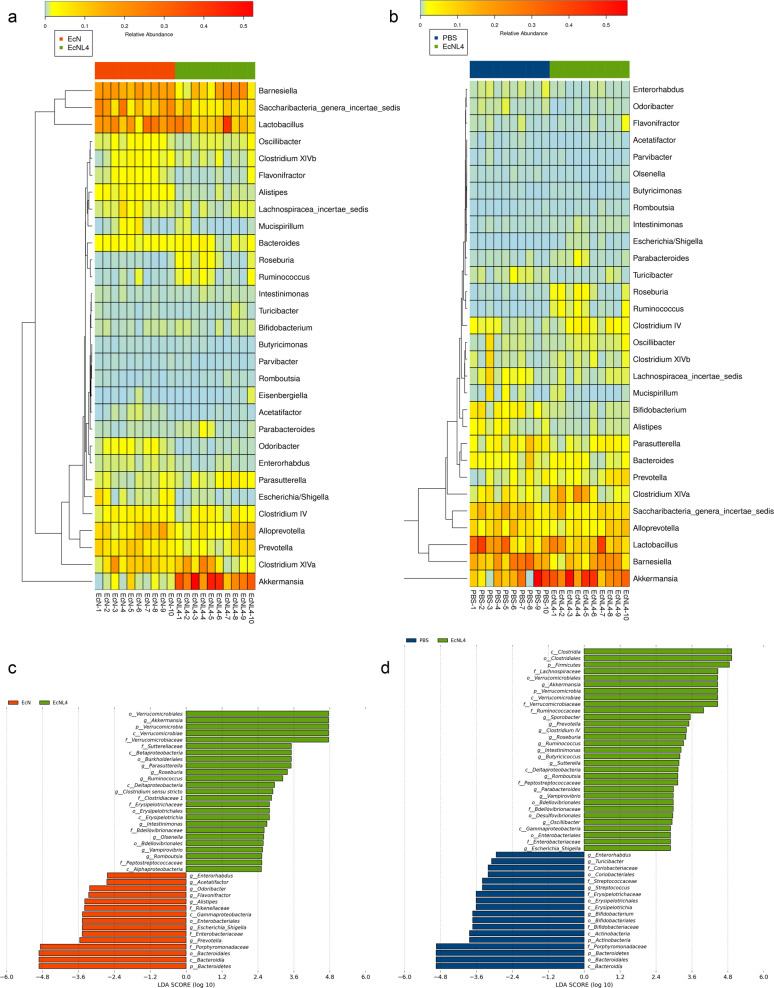
Fig. 4.
Gut microbiomes changed after EcNL4 administration in mice. a General gut microbiota genus differences between EcN and EcNL4 administration. b General gut microbiota genus differences between PBS and EcNL4 administration. Feces were collected 3 days after bacterial gavage. Data are presented in the heatmap. The color gradient represents the relative abundances in the samples. Vertical clustering indicates the similarity of all species between different samples. c LEfSe difference analysis between the EcN and EcNL4 groups. d LEfSe difference analysis between the PBS and EcNL4 groups. The figures represent the linear discriminant analysis (LDA) scores that suggested microorganisms with significant impacts on the differences of groups in microflora. The threshold was 2 in LDA analysis

