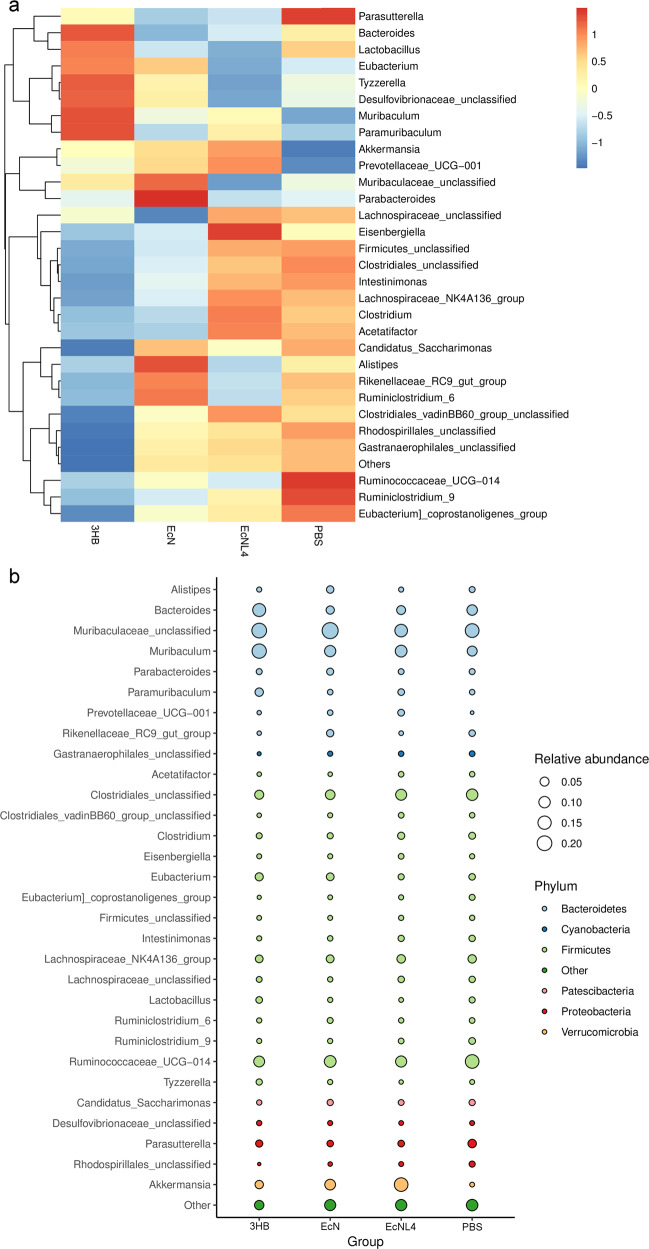
Fig. 6.
Gut microbiome changes after administration of bacteria in mice with colitis. a Gut microbiota differences at the genus level in the mice with colitis. Feces were collected 3 days after bacterial gavage. Data are presented in the heatmap. The color gradient represents the relative abundances in samples. Vertical clustering indicates the similarity of all species between different samples. b The relative abundance of different genera in the groups of mice with colitis. Data are exhibited in the bubble map format. The size of the bubbles represents the relative abundance of the corresponding genus. The different colors in the bubble indicate the phylum annotations of specific genera

