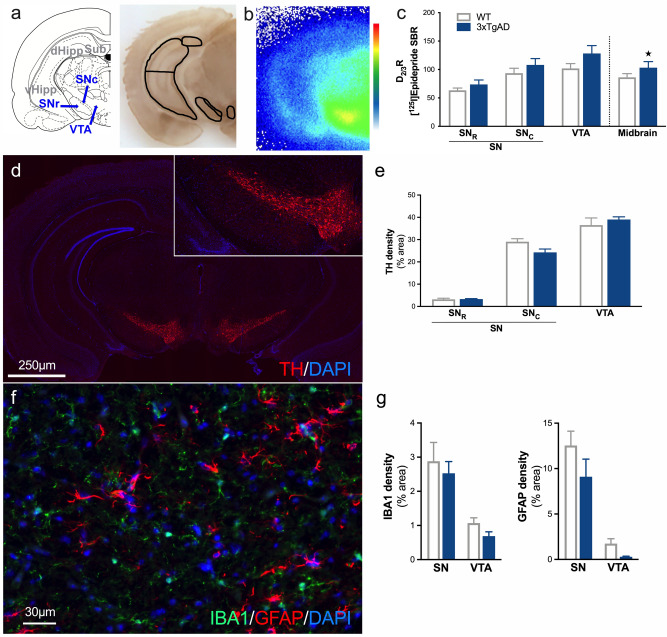
Figure 3.
Increases in presynaptic D2/3R, without inflammation modulation, in the midbrain of 3xTg-AD mice. (a) Schematic representation of different areas of the midbrain and hippocampus which have been drawn manually according to the acetylcholinesterase staining anatomy. (b) Example of in situ labeling with [125I]Epidepride. Color scale refers to activity in the autoradiograms (from 0 to 500 MBq/mg). (c) Assessment of the D2/3R density by [125I]Epidepride specific binding ratio (SBR) quantification. (d) Example of staining at the level of the midbrain for DAPI (blue) and TH (red). (e) Quantification of the area occupied by TH staining. (f) Example of immunofluorescence for DAPI (blue), IBA1 (green) and GFAP (red) in the substantia nigra. (g) Quantification of the area occupied by IBA1 and GFAP staining. ★: p < 0.05.

