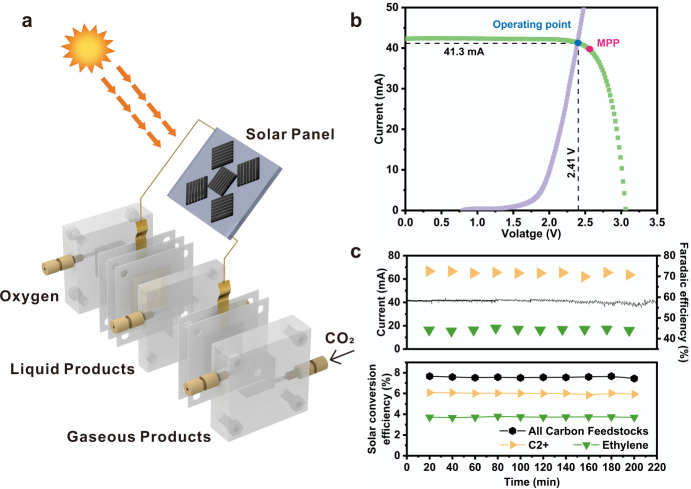
Fig. 4. Solar-powered CO2 reduction.
a Schematic of the PV-EC system. b Photovoltaic and electrocatalytic I-V behaviors. The photovoltaic performance is shown under light (green) with the MPP marked by a red dot. The measured operating current of the CO2 electrolysis system (cathode, anode, and anion exchange membrane) at different voltages has been marked by the purple curve. The observed long-term operating point is marked by a blue dot, with the black dashed lines showing the corresponding current and voltage. c Faradaic efficiency towards ethylene and C2+ products, solar current, and solar conversion efficiency as a function of reaction time. Carbon feedstocks include CO, methane, ethylene, ethanol, and n-propanol. C2+ products include ethylene, ethanol, and n-propanol.

