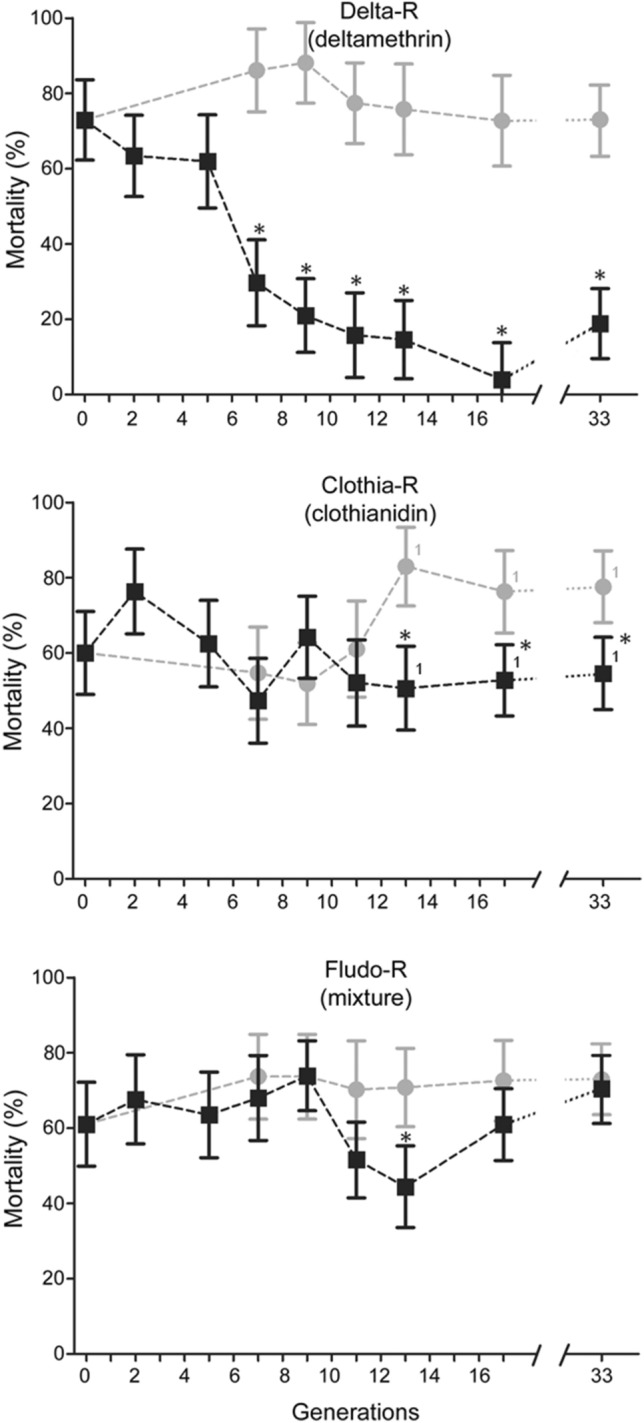
Figure 1.

Resistance dynamics of each line along the selection process. Black squares: resistance of each selected line to the insecticide used for selection. Grey dots: resistance of the non-selected Tiassalé-S line. Resistance levels were compared using bottle assays and are expressed as mean % mortality ± 95% Wald confidence interval. Comparisons between each line and the Tiassalé-S line at each time point were performed using a Fisher test on mortality proportions (*p < 0.05). 1Indicate that a new clothianidin solution was used for monitoring resistance levels at G13, G17 and G33, leading to higher clothianidin mortality rates as compared to previous generations.
