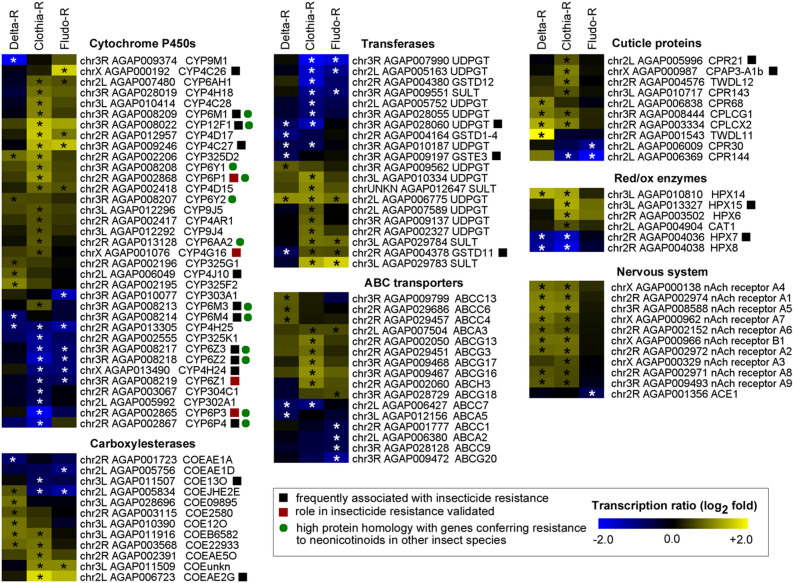
Figure 4.
Transcription profiles of candidate genes associated with resistance. All candidate genes differentially transcribed in at least one selected line are shown. Colour scale shows the mean Log2 Fold Change between each selected line and the parental Tiassalé-S line. Stars indicate a significant differential transcription (FC > 1.5-fold and corrected P value ≤ 0.005). Black squares indicate genes frequently associated insecticide resistance. Red squares indicate functionally validated resistance genes. Green dots indicate genes showing high protein homology with genes conferring resistance to neonicotinoids in other insect species.

