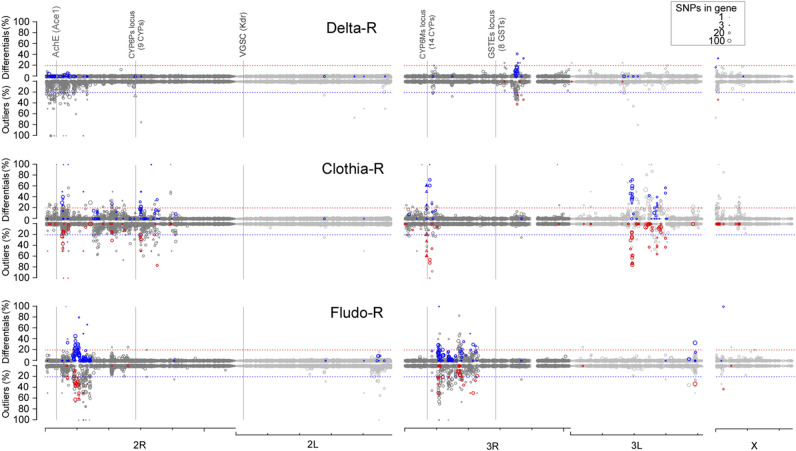
Figure 5.
Selection signatures observed in each selected line. Selection signatures as compared to the non-selected Tiassalé-S line were computed using the 145,008 bi-allelic polymorphic SNPs detected by RNA-seq. The upper Y axis shows the proportion of differential SNPs per gene as obtained by the frequency-based approach while the lower Y axis shows the proportion of outliers per gene as obtained by the Fst-based approach. For each approach, blue/red marks indicate genes showing a differential/outlier proportion higher than 20% with the alternative approach (red/blue dashed lines). Symbol size is proportional to the number of polymorphic SNPs per gene. Triangles indicate candidate genes potentially involved in insecticide resistance. Filled symbols indicate the presence of differential SNPs/outliers affecting protein sequence. Loci commonly associated with insecticide resistance in An. gambiae are indicated (VGSC, AchE, CYP6Ps cluster, CYP6Ms cluster and GSTEs cluster). The genomic scale shows chromosome arms with ticks every 10 Mb.

