Figure 6.
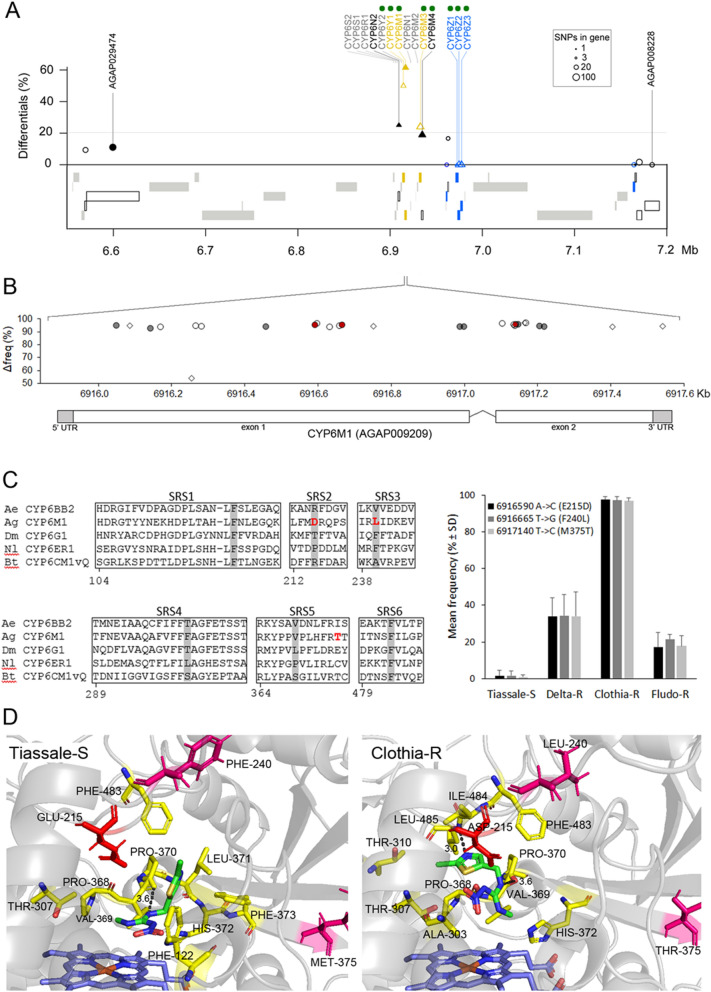
Response to clothianidin selection on the CYP6Ms locus. (A) Overview of RNA-seq data at the CYP6M locus for the Clothia-R line. The Y axis shows the proportion of differential SNPs per gene as obtained by the frequency-based approach. Genes in grey were not covered by polymorphic SNPs. Significant transcription level variations in the Clothia-R line as compared to the non-selected Tiassalé-S line are indicated by colours (yellow: over-transcribed, blue: under-transcribed, black: not differentially transcribed). Triangles indicate candidate genes. Filled symbols indicate the presence of differential/outlier SNPs affecting protein sequence. Green dots indicate genes showing high protein homology with genes conferring resistance to neonicotinoids in other insect species. (B) Distribution of differential SNPs on CYP6M1. The Y axis shows the frequency variation between the Clothia-R line and the Tiassalé-S line. Empty symbols: synonymous variations, filled symbols: non-synonymous variations. Symbol form indicate that the variant (circles) or the reference (lozenges) allele is enriched in the Clothia-R line. Red symbols indicate the two non-synonymous variations affecting the conformation of the active site. (C) Focus on non-synonymous variations affecting the active site. Left: non-synonymous variations affecting CYP6M1 substrate recognition site regions (SRS) in the Clothia-R variant. Amino acid in grey are those shown to interact with the binding of the neonicotinoid imidacloprid in Bemiscia tabaci CYP6CM1vQ (Karunker et al.42), Nilaparvata lugens CYP6ER1 (Pang et al.75) and Aedes aegypti CYP6BB2 (Riaz et al.38). Right: allele frequencies of the two non-synonymous variations likely interacting with the binding of clothianidin across all lines. D: In silico models of CYP6M1 protein variants identified in the Tiassalé-S and Clothia-R lines docked with heme (blue) and clothianidin (green). The best models obtained according to Rosetta-computed force fields are shown for each variant. Yellow residues are within 3.5 Å of the ligand. Residues differing between the two variants in SRS regions are shown in magenta. The Glu/Asp-215 located within 3.5 Å of the ligand in the Clothia-R variant but not in the Tiassalé-S variant is shown in red. Dark dashed lines show hydrogen bonds between the ligand: Val-369 (both variants), Leu-485 (Clothia-R variant only).

