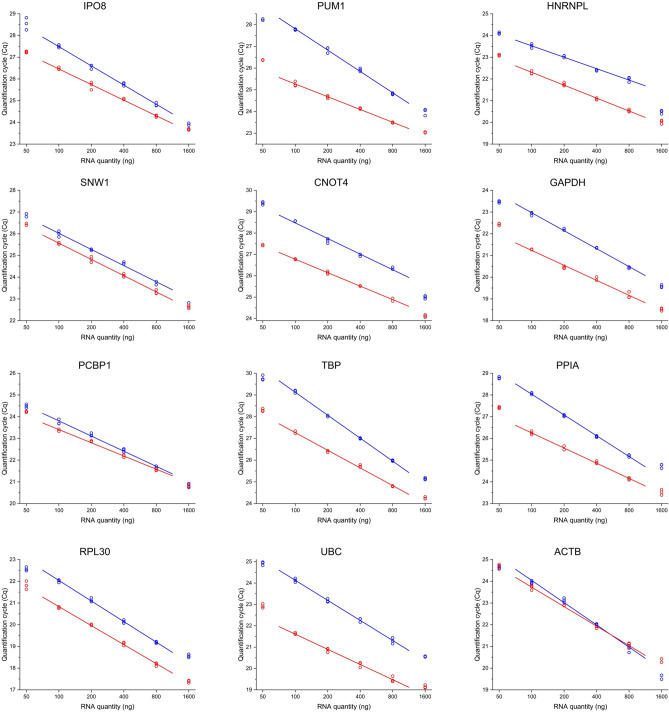
Figure 1.
Optimization of the reverse transcription conditions. The graph shows Cq values from performing qPCR measurements of RNA dilution series comparing the Maxima First Strand cDNA Synthesis Kit for RT-qPCR (red lines) and the High-Capacity cDNA Reverse Transcription Kit (blue lines). Three technical replicates for both kits at each concentration point are marked as hollow circles. Least squares linear regression was performed to the average of the technical replicates in the range of RNA amount from 100 to 800 ng per reaction. Individual graphs were created with OriginPro 2018 (OriginLab Corp.) and the figure was assembled using CorelDRAW Graphics Suite 2020 (Corel Corporation).

