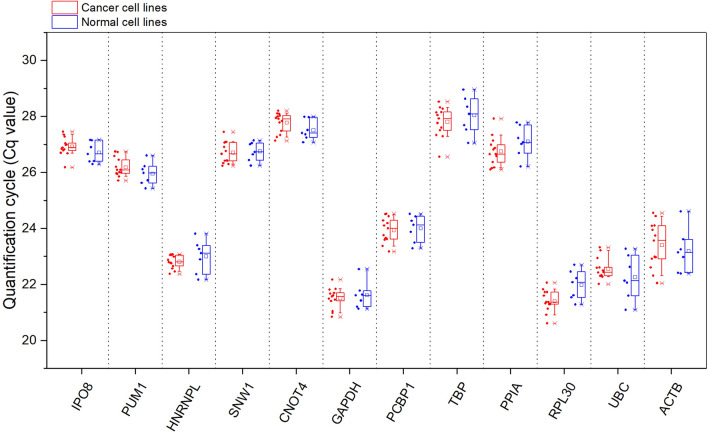
Figure 2.
Cq values of twelve candidate reference genes in human cancer (red) and normal (blue) cell lines. Each dot represents the average Cq value of three biological replicates for each cell line. Candidate reference genes are arranged according to the comprehensive ranking in a decreasing order of expression stability. The boxes represent the data between the 25th and 75th percentile, while whiskers show the data range from the 10th to the 90th percentile. The minimum and maximum values are depicted as ‘x’. The average values are represented as squares and the median values are illustrated as lines. This graph was created with OriginPro 2018 (OriginLab Corp.).

